Section author: Danielle J. Navarro and David R. Foxcroft
Internal consistency reliability analysis
After you have been through the process of initial scale development using EFA and CFA, you should have reached a stage where the scale holds up pretty well using CFA with different samples. One thing that you might also be interested in at this stage is to see how well the factors are measured using a scale that combines the observed variables.
In psychometrics we use reliability analysis to provide information about how consistently a scale measures a psychological construct (see section Assessing the reliability of a measurement). Internal consistency is what we are concerned with here, and that refers to the consistency across all the individual items that make up a measurement scale. So, if we have V1, V2, V3, V4 and V5 as observed item variables, then we can calculate a statistic that tells us how internally consistent these items are in measuring the underlying construct.
A popular statistic used to check the internal consistency of a scale is Cronbach’s α (alpha; Cronbach, 1951). Cronbach’s α is a measure of equivalence (whether different sets of scale items would give the same measurement outcomes). Equivalence is tested by dividing the scale items into two groups (a “split-half”) and seeing whether analysis of the two parts gives comparable results. Of course, there are many ways a set of items could be split, but if all possible splits are made then it is possible to produce a statistic that reflects the overall pattern of split-half coefficients. Cronbach’s α is such a statistic: a function of all the split-half coefficients for a scale. If a set of items that measure a construct (e.g. an Extraversion scale) has an α of 0.80, then the proportion of error variance in the scale is 0.20. In other words, a scale with an α of 0.80 includes approximately 20% error.
BUT, (and that’s a BIG “BUT”), Cronbach’s α is not a measure of unidimensionality (i.e. an indicator that a scale is measuring a single factor or construct rather than multiple related constructs). Scales that are multidimensional will cause α to be under-estimated if not assessed separately for each dimension, but high values for α are not necessarily indicators of unidimensionality. So, an α of 0.80 does not mean that 80% of a single underlying construct is accounted for. It could be that the 80% comes from more than one underlying construct. That’s why EFA and CFA are useful to do first.
Further, another feature of α is that it tends to be sample specific: it is not a characteristic of the scale, but rather a characteristic of the sample in which the scale has been used. A biased, unrepresentative, or small sample could produce a very different α coefficient than a large, representative sample. α can even vary from large sample to large sample. Nevertheless, despite these limitations, Cronbach’s α has been popular in Psychology for estimating internal consistency reliability. It’s pretty easy to calculate, understand and interpret, and therefore it can be a useful initial check on scale performance when you administer a scale with a different sample, from a different setting or population, for example.
An alternative is McDonald’s ω (omega), and jamovi also provides this statistic. Whereas α makes the following assumptions: (a) no residual correlations, (b) items have identical loadings, and (c) the scale is unidimensional, ω does not and is therefore a more robust reliability statistic. If these assumptions are not violated then α and ω will be similar, but if they are then ω is to be preferred.
Sometimes a threshold for α or ω is provided, suggesting a “good enough” value. This might be something like αs of 0.70 or 0.80 representing “acceptable” and “good” reliability, respectively. However, this does depend on what exactly the scale is supposed to be measuring, so thresholds like this should be used cautiously. It could be better to simply state that an α or ω of 0.70 is associated with 30% error variance in a scale, and an α or ω of 0.80 is associated with 20%.
Can α be too high? Probably: if you are getting an α coefficient above 0.95 then this indicates high inter-correlations between the items and that there might be too much overly-redundant specificity in the measurement, with a risk that the construct being measured is perhaps overly narrow.
Reliability analysis in jamovi
We have a third sample of personality data to use to undertake reliability
analysis: in the bfi_sample3 data set. Once again, check that the 25
personality item variables are coded as continuous  . To perform
reliability analysis in jamovi:
. To perform
reliability analysis in jamovi:
- Select
Factor→Reliability Analysisfrom theAnalysestab in jamovi to open the options panel where you can determine the settings for the reliability analysis (Fig. 198). - Select the 5
A-variables and transfer them into theItemsbox. - Under the
Reverse Scaled Itemsoption, select variableA1in theNormal Scaled Itemsbox and move it across to theReverse Scaled Itemsvariable box. - Check other appropriate options, as in Fig. 198.
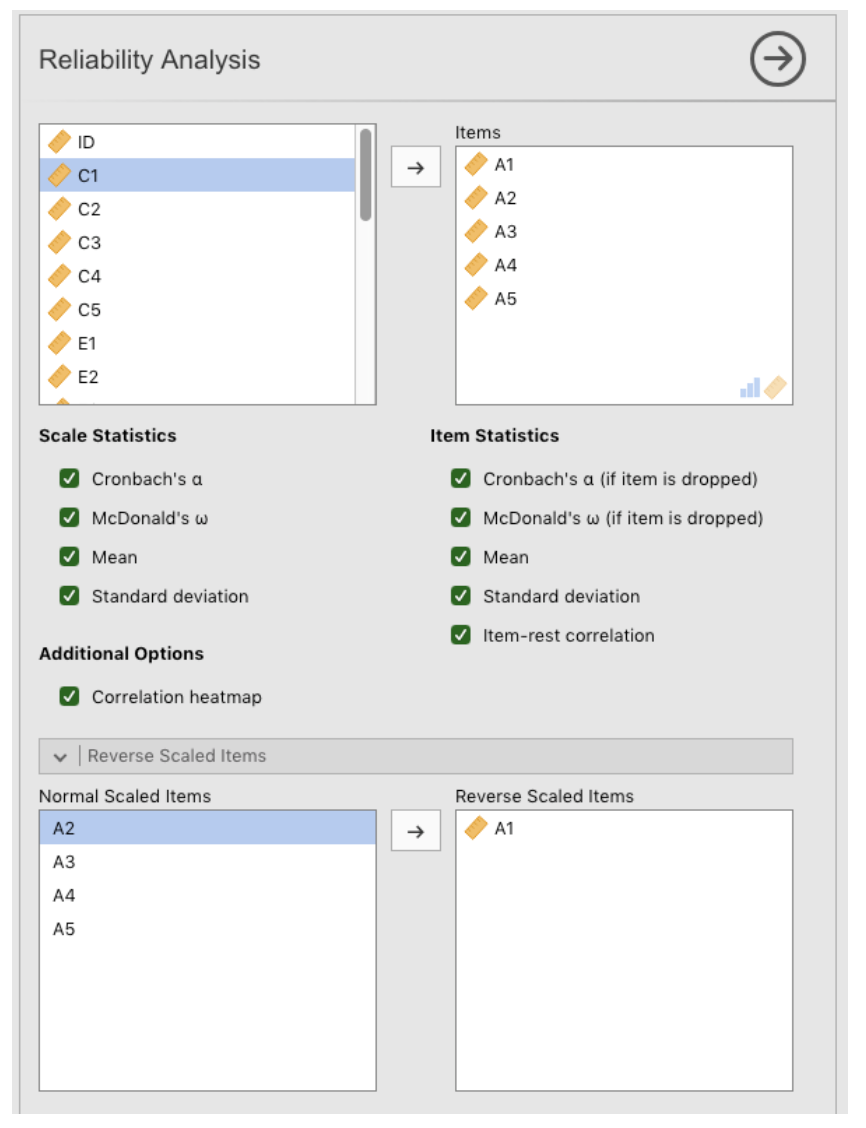
Fig. 198 Options panel with the settings for conducting a Reliability Analysis in jamovi
Once done, look across at the jamovi results window. You should see something like Fig. 199. This tells us that the Cronbach’s α coefficient for the Agreeableness scale is 0.72. This means that just under 30% of the Agreeableness scale score is error variance. McDonald’s ω is also given, and this is 0.74, not much different from α.
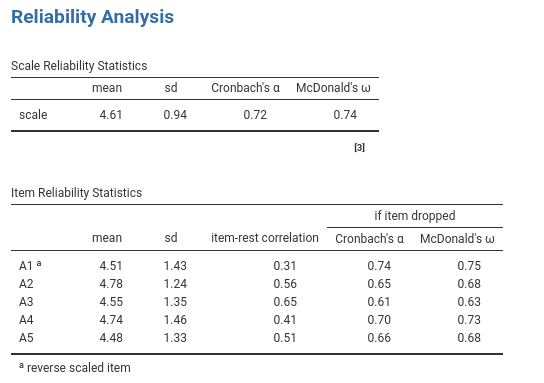
Fig. 199 Tables with the results of the Reliability Analysis for the Agreeableness
factor from the bfi_sample3 data set
We can also check how α or ω can be improved if a specific item is dropped from the scale. For example, α would increase to 0.72 and ω to 0.74 if we dropped item A1. This isn’t a big increase, so probably not worth doing.
The process of calculating and checking scale statistics (α and ω) is the same for all the other scales, and they all had similar reliability estimates apart from Openness (α = 0.60, ω = 0.62). For Openness, the amount of error variance in the Scale score is around 40%, which is high and indicates that Openness is substantially less consistent as a reliable measure of a personality attribute than the other personality scales.