Section author: Danielle J. Navarro and David R. Foxcroft
One-sided tests
When introducing the theory of null hypothesis tests, I mentioned that there
are some situations when it’s appropriate to specify a one-sided test (see
section The difference between one-sided and two-sided tests). So far all of the t-tests have been two-sided
tests. For instance, when we specified a one sample t-test for the grades in
Dr Zeppo’s class the null hypothesis was that the true mean was 67.5%. The
alternative hypothesis was that the true mean was greater than or less
than 67.5%. Suppose we were only interested in finding out if the true mean
is greater than 67.5%, and have no interest whatsoever in testing to find
out if the true mean is lower than 67.5%. If so, our null hypothesis would be
that the true mean is 67.5% or less, and the alternative hypothesis would be
that the true mean is greater than 67.5%. In jamovi, for the One Sample
T-Test analysis, you can specify this by clicking on the > Test Value
option, under Hypothesis. When you have done this, you will get the results
as shown in Fig. 98.
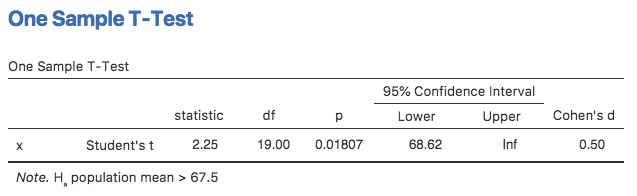
Fig. 98 jamovi results showing a One Sample T-Test where the actual hypothesis
is one-sided, i.e. that the true mean is greater than 67.5%.
Notice that there are a few changes from the output that we saw last time. Most
important is the fact that the actual hypothesis has changed, to reflect the
different test. The second thing to note is that although the t-statistic and
degrees of freedom have not changed, the p-value has. This is because the
one-sided test has a different rejection region from the two-sided test. If
you’ve forgotten why this is and what it means, you may find it helpful to read
back over chapter Hypothesis testing, and section
The difference between one-sided and two-sided tests in particular. The third thing to note is
that the confidence interval is different too: it now reports a “one-sided”
confidence interval rather than a two-sided one. In a two-sided confidence
interval we’re trying to find numbers a and b such that we’re confident
that, if we were to repeat the study many times, then 95% of the time the mean
would lie between a and b. In a one-sided confidence interval, we’re
trying to find a single number a such that we’re confident that 95% of the
time the true mean would be greater than a (or less than a if you
selected Measure 1 < Measure 2 in the Hypothesis section).
So that’s how to do a one-sided one sample t-test. However, all
versions of the t-test can be one-sided. For an independent
samples t-test, you could have a one-sided test if you’re only
interested in testing to see if group A has higher scores than group
B, but have no interest in finding out if group B has higher scores than
group A. Let’s suppose that, for Dr Harpo’s class, you wanted to see if
Anastasia’s students had higher grades than Bernadette’s. For this
analysis, in the Hypothesis options, specify that Group 1 > Group2.
You should get the results shown in Fig. 99.
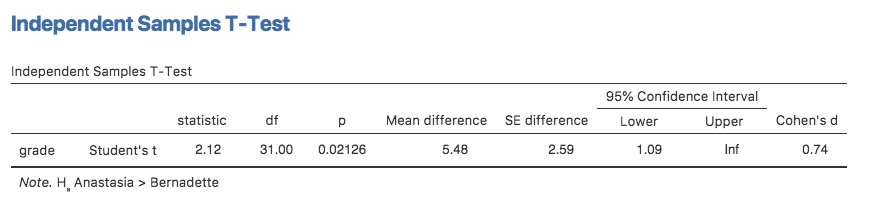
Fig. 99 jamovi results showing an Independent Samples T-Test where the actual
hypothesis is one-sided, i.e. that Anastasia’s students had higher grades
than Bernadette’s.
Again, the output changes in a predictable way. The definition of the alternative hypothesis has changed, the p-value has changed, and it now reports a one-sided confidence interval rather than a two-sided one.
What about the paired samples t-test? Suppose we wanted to test
the hypothesis that grades go up from test 1 to test 2 in Dr Zeppo’s
class, and are not prepared to consider the idea that the grades go
down. In jamovi you would do this by specifying, under the Hypotheses
option, that grade_test2 (Measure 1 in jamovi, because we copied
this first into the paired variables box) > grade_test1
(Measure 2 in jamovi). You should get the results shown in
Fig. 100.
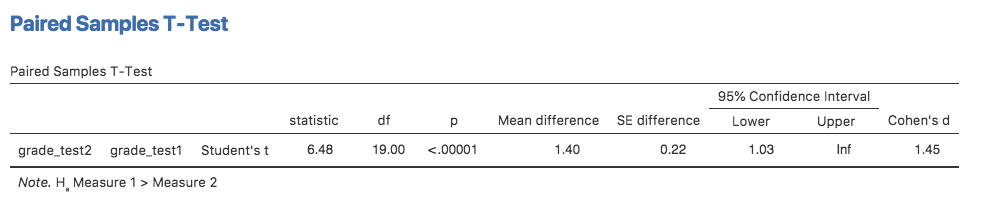
Fig. 100 jamovi results showing a Paired Samples T-Test where the actual
hypothesis is one-sided, i.e. that grade test2 (Measure 1) is larger
than grade test1 (Measure 2).
Yet again, the output changes in a predictable way. The hypothesis has changed, the p-value has changed, and the confidence interval is now one-sided.