Auteur de la section : Danielle J. Navarro and David R. Foxcroft
The spreadsheet
It is possible to simply begin typing values into the jamovi spreadsheet as you would in any other spreadsheet software. Alternatively, existing data sets can be opened in jamovi (see the section “Loading data in jamovi” further down on the page).
In jamovi data is represented in a spreadsheet with each column representing a “variable” and each row representing a “case” or “participant”.
Data Variables
The most commonly used variables in jamovi are Data variables, these
variables simply contain data either loaded from a data file, or “typed in” by
the user. Data variables can be one of four measurement levels
(Fig. 4). These levels are designated by the symbol in the header of
the variable’s column:
The
IDvariable type is unique to jamovi. It is intended for
variables that contain identifiers that you would almost never want to
analyse. For example, a persons name, or a participant ID. Specifying an ID
variable type can improve performance when interacting with very large data
sets.
is unique to jamovi. It is intended for
variables that contain identifiers that you would almost never want to
analyse. For example, a persons name, or a participant ID. Specifying an ID
variable type can improve performance when interacting with very large data
sets.Nominalvariables are for categorical variables which are text
labels, for example a column called
are for categorical variables which are text
labels, for example a column called genderwith the valuesmaleandfemalewould be nominal. So would a person’s name. Nominal variable values can also have a numeric value. These variables are used most often when importing data which codes values with numbers rather than text. For example, a column in a data set may contain the values 1 formale, and 2 forfemale. It is possible to add nice “human-readable” labels to these values with the variable editor (more on this later).Ordinalvariables are like
 Nominalvariables, except the values have a specific order. An example is a Likert scale with 3 being “strongly agree” and -3 being “strongly disagree”.Continuousvariables are variables which exist on a
continuous scale. Examples might be height or weight. This is also referred
to as “interval scale” or “ratio scale”.
are variables which exist on a
continuous scale. Examples might be height or weight. This is also referred
to as “interval scale” or “ratio scale”.
In addition, you can also specify different data types: variables have a data
type of either Text, Integer or Decimal. They determine how these
data are stored. Typically, it is neither required nor recommended to change
the data type.
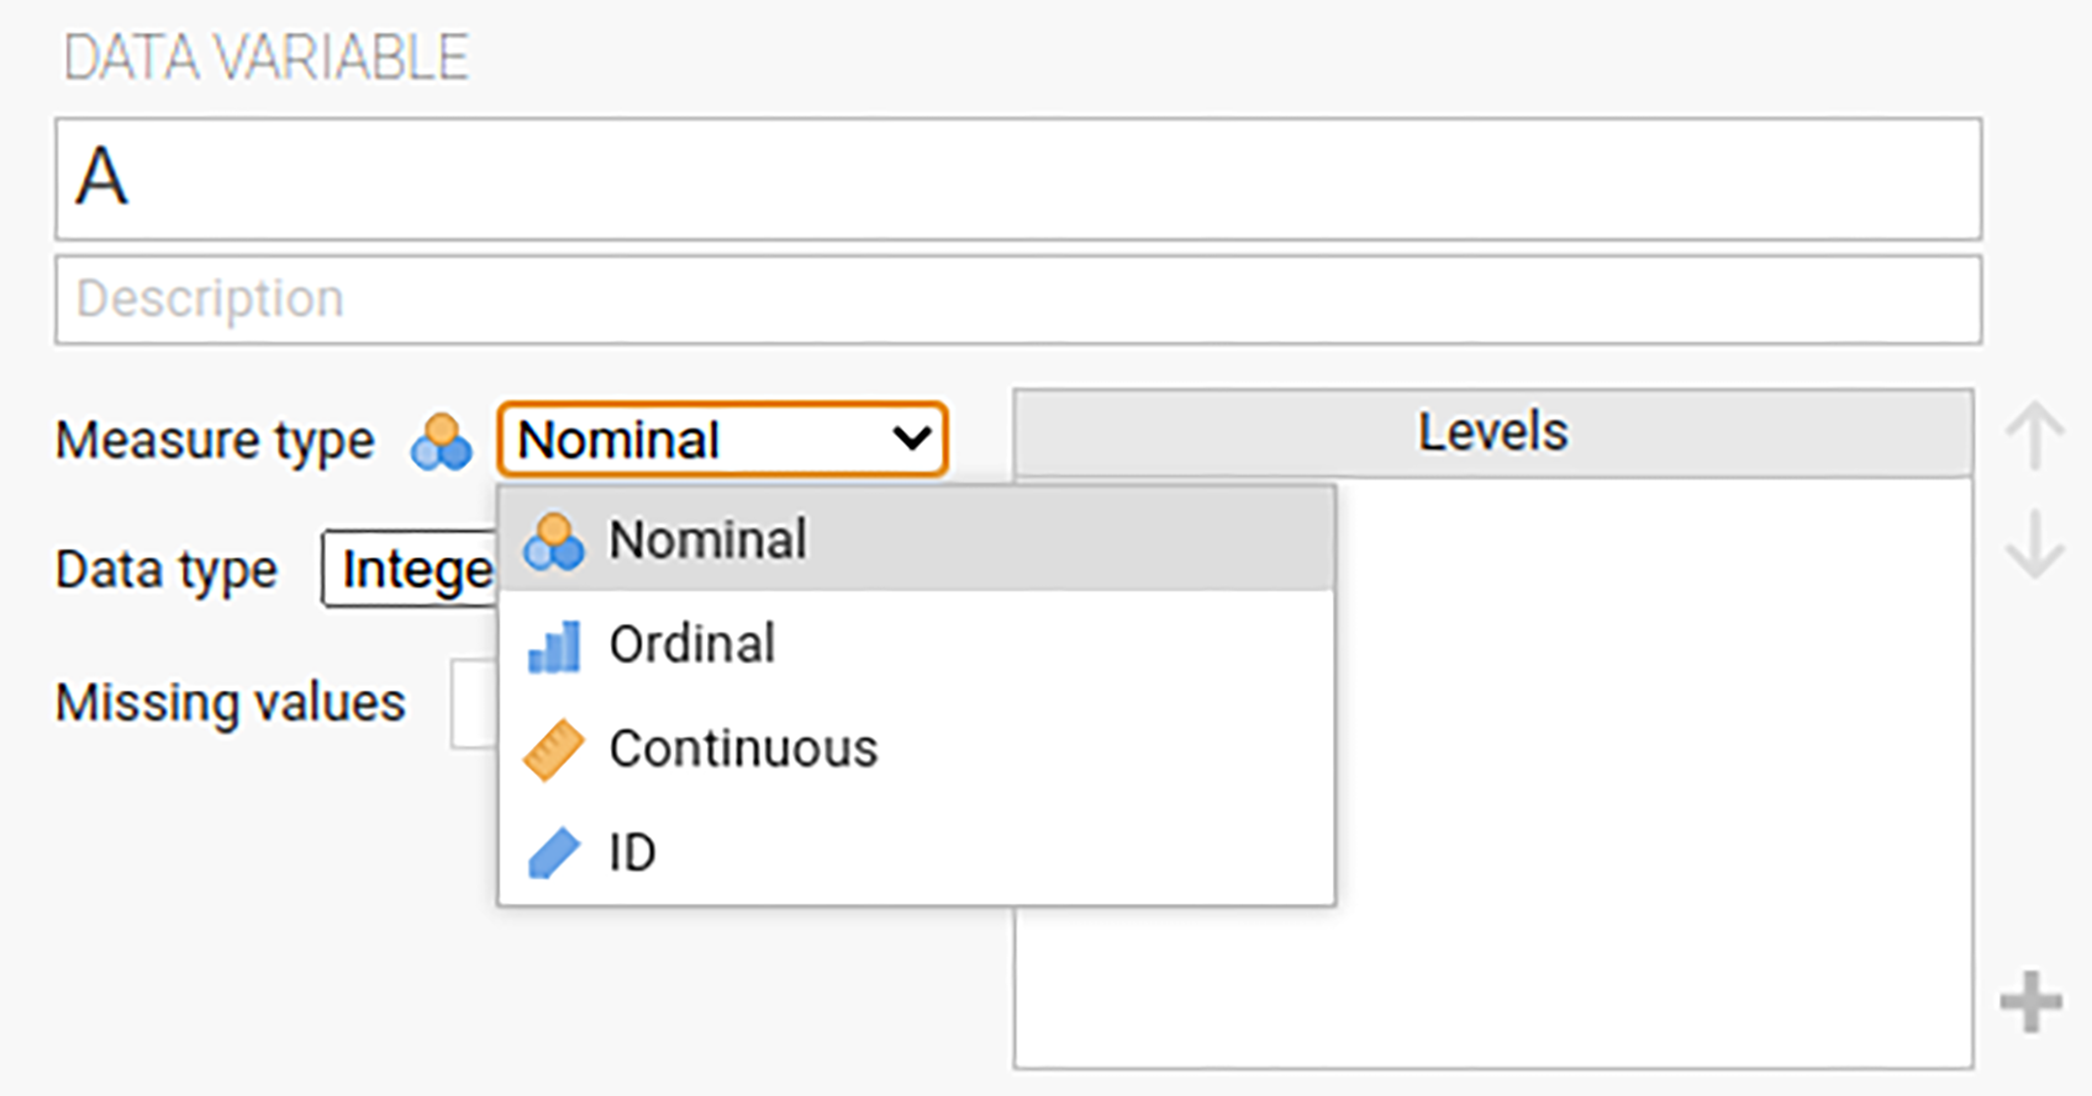
Fig. 4 Window to set measurement levels and data types in jamovi.
When starting with a blank spreadsheet and typing values in the variable type will change automatically depending on the data you enter. This isa good way to get a feel for which variable types go with which sorts of data. Similarly, when opening a data file jamovi will try and guess the variable type from the data in each column. In both cases this automatic approach may not be correct, and it may be necessary to manually specify the variable type with the variable editor.
The variable editor can be opened by selecting Setup from the Data
ribbon or by double-clicking on the variable column header. The variable
editor allows you to change the name of the variable and, for data variables,
the measure type, the order of the value levels, and the label displayed for
each level. The variable editor can be dismissed by clicking ↑.
New variables can be inserted or appended to the data set using the Add
button from the Data tab. The Add button also allows the addition
of computed variables.
Changing data from one level to another
Sometimes you want to change the variable level. This can happen for all sorts
of reasons. Sometimes when you import data from files, it can come to you in
the wrong format. Numbers sometimes get imported as nominal , text
values. Dates may get imported as text. Participant-ID values can
sometimes be read as continuous : nominal values can
sometimes be read as ordinal or even continuous . There is
a good chance that sometimes you will want to convert a variable from one
measurement level into another one. Or, to use the correct term, you want to
coerce the variable from one class into another.
If you want to change a variable’s measurement level then you can do this in
the jamovi Data view. Click on the variable name in the top row of the data
table and then select the desired measurement level under Measure Type –
continuous , ordinal or nominal .
Computed Variables
Computed variables are those which take their value by performing a computation on other variables. Computed variables can be used for a range of purposes, including log transforms, z-scores, sum-scores, negative scoring and means.
Computed variables can be added to the data set with the Add button
available on the Data tab. This will produce a formula box where you can
specify the formula. The usual arithmetic operators are available. Some
examples of formulas are:
A + B
LOG10(len)
MEAN(A, B)
(dose - VMEAN(dose)) / VSTDEV(dose)
In order, these are the sum of A and B, a log (base 10) transform of
len, the mean of A and B, and the z-score of the variable
dose. Fig. 5 shows the jamovi screen for the new variable
computed as the z-score of dose (from the Tooth Growth example data
set). How to create and use computed variables is
elaborated later.
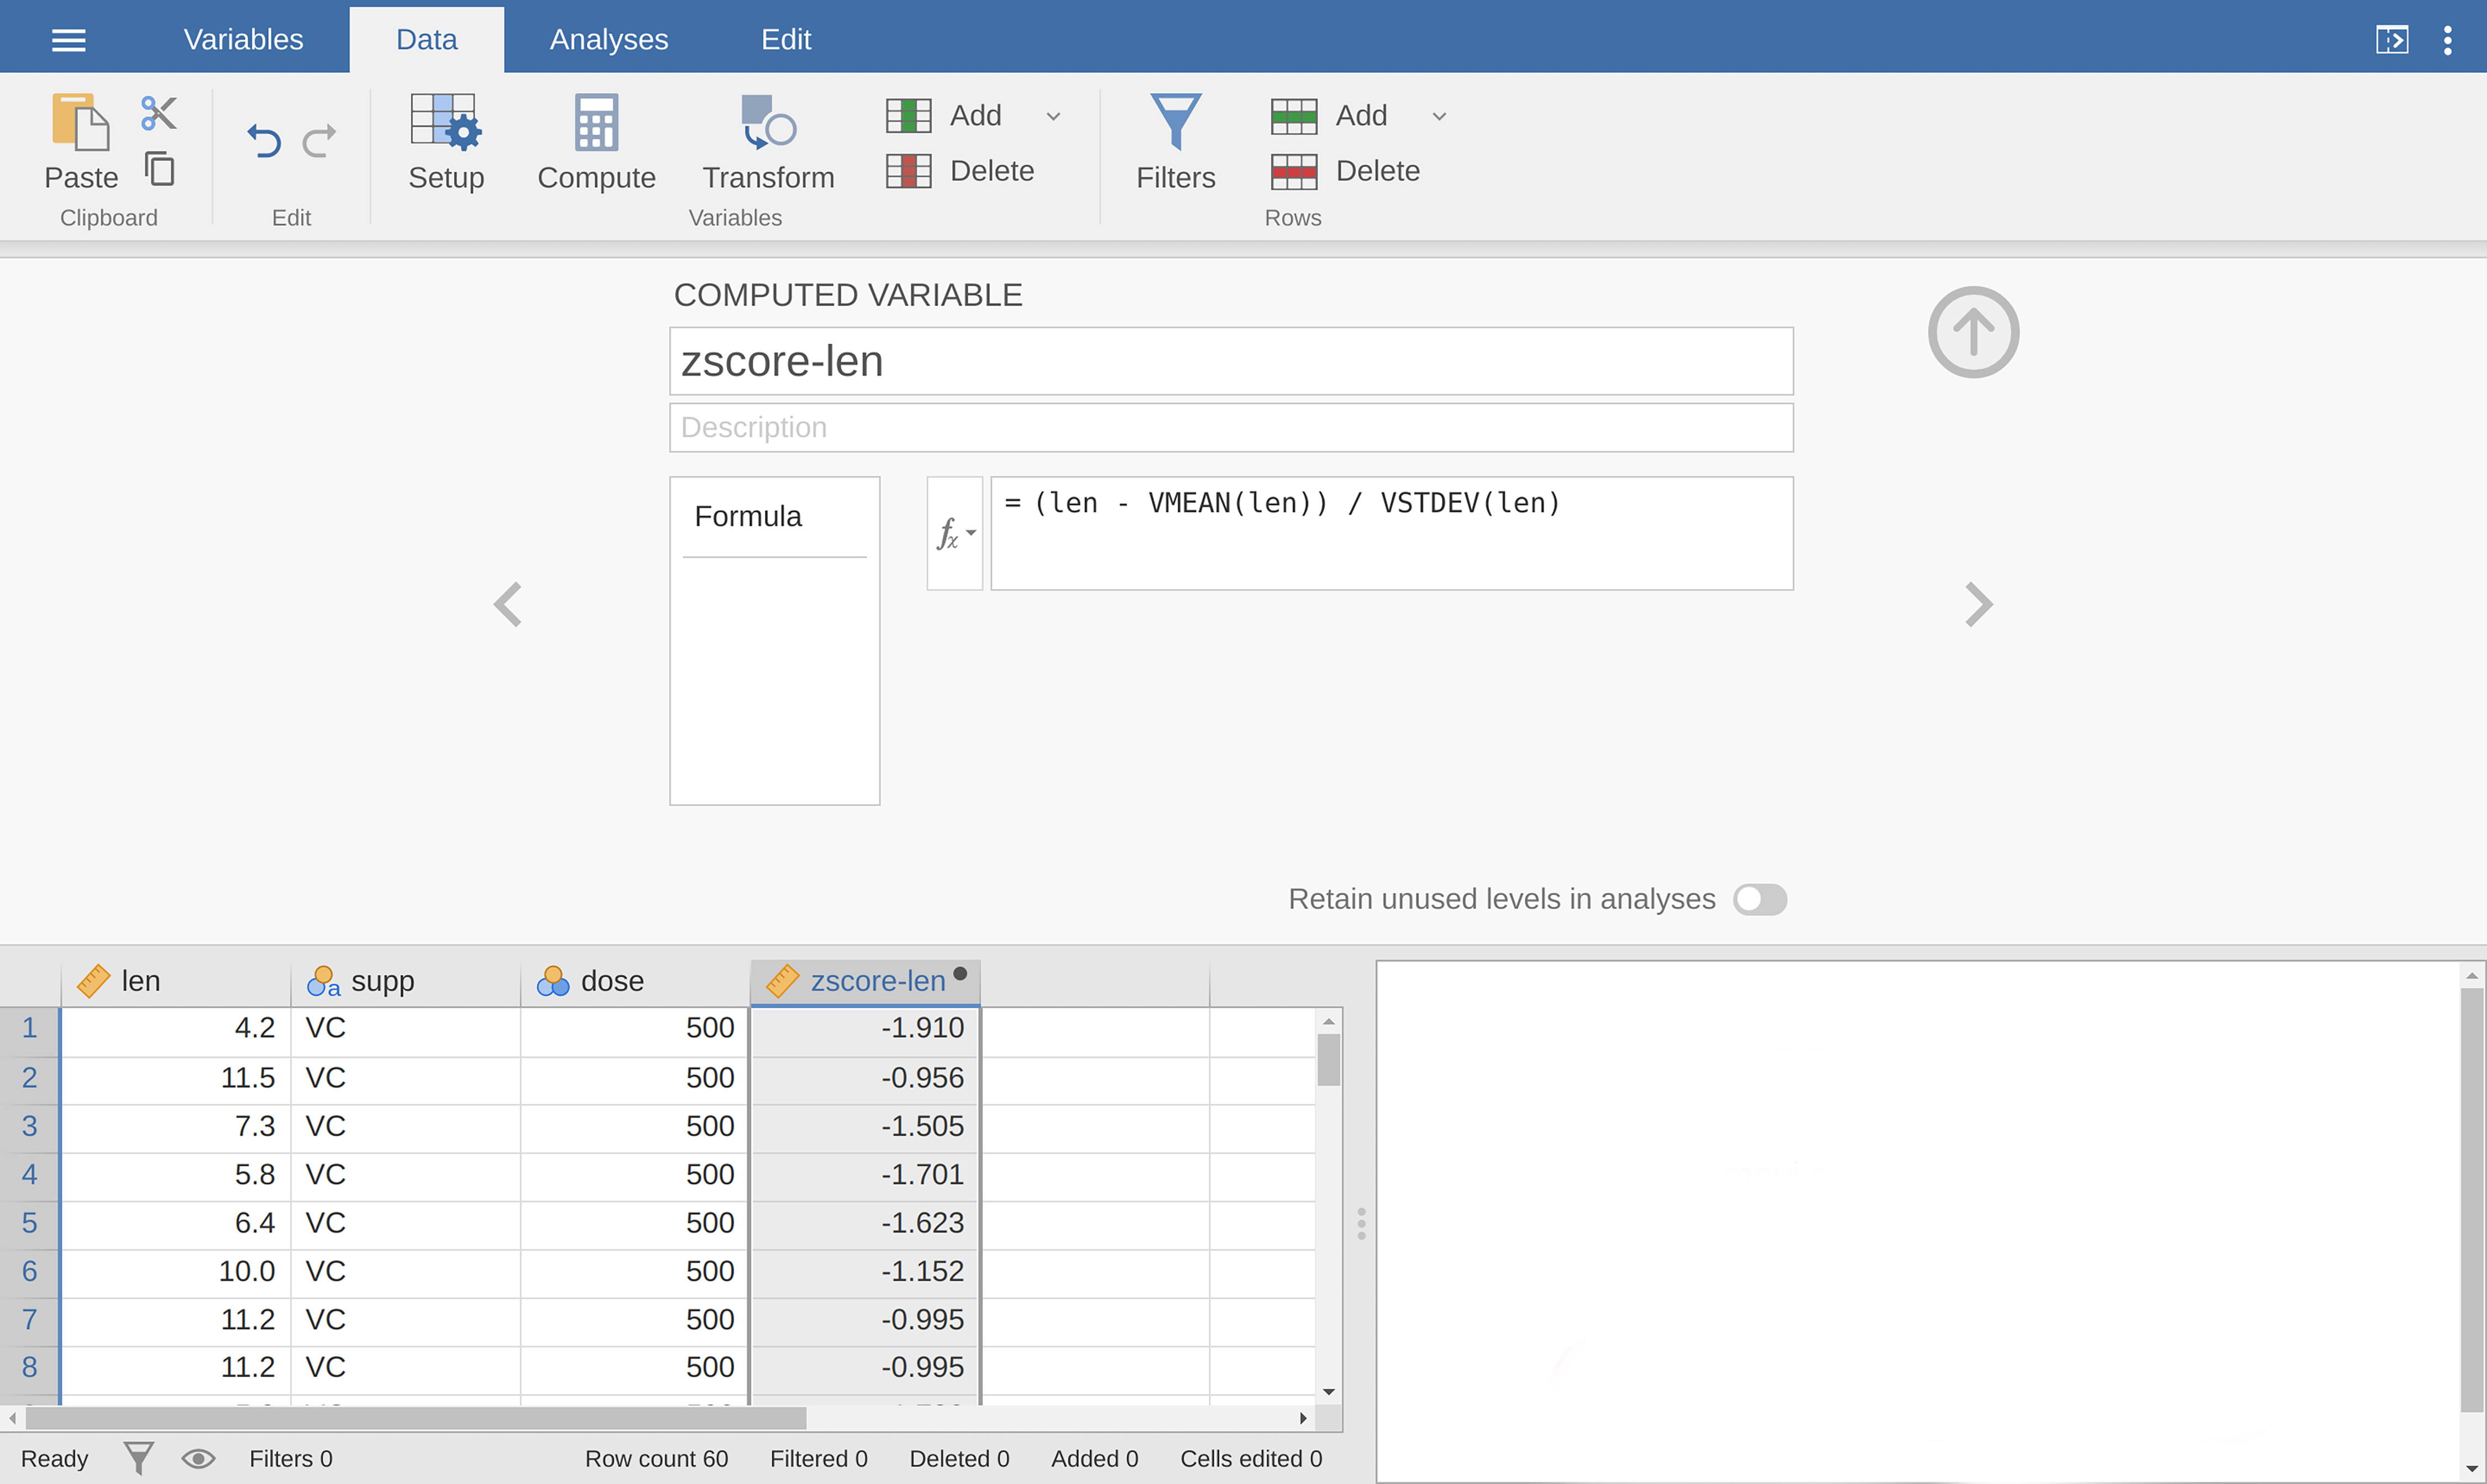
Fig. 5 A newly computed variable, the z-score of dose.
V-functions
Several functions are already available in jamovi and available from the
drop-down box labelled fx. A number of functions appear in pairs,
one prefixed with a V and the other not. V functions perform their calculation
on a variable as a whole, where as non-V functions perform their calculation
row by row. For example, MEAN(A, B) will produce the mean of A and
B for each row. Where as VMEAN(A) gives the mean of all the values in
A.
Transformed Variables
The transformation that is used when creating this type of variable, relies on a “receipe” that is created once and can then be applied to multiple variables. This section describes in more detail how to generate such a “receipe”. Transformed variables are often used to “recode” variables (e.g., when inverting items), a typical transformation which described in more detail at the end of the subsection EFA in jamovi and in Fig. 202. When transforming or recoding variables in jamovi, a new “transformed variable” is created from an original “source variable”. This permits you to have access to both the original, untransformed data, and the transformed data.
After having created a transformation, you can apply this transformation using the transform editor. It lets you define the name and the description of the transformed variable to be created, which source variable should be used and which transformation should be applied (all transformations that already were defined are available from a drop-down menu in the editor).