Auteur de la section : Danielle J. Navarro and David R. Foxcroft
Transforming variables
It is not uncommon in real-world data analysis to find that one of your
variables is not quite equivalent to the variable that you really want. For
instance, it is often convenient to take a continuous variable  (e.g., age) and break it up into a smallish number of categories (e.g.,
younger, middle, older). At other times, you may need to convert a
numeric variable into a different numeric variable (e.g., you may want
to analyse at the absolute value of the original variable). In this
section I will describe a few key ways you can do these things in jamovi.
(e.g., age) and break it up into a smallish number of categories (e.g.,
younger, middle, older). At other times, you may need to convert a
numeric variable into a different numeric variable (e.g., you may want
to analyse at the absolute value of the original variable). In this
section I will describe a few key ways you can do these things in jamovi.
Almost anything you do to a variable is a transformation. In jamovi, there are two kinds of such variable transformations. In one case, you create a new variable based upon an (often mathematical) function. This type of transformed variable is called a Computed Variable. In the other case, you create a new variable based upon some rule set, determining how each value in the original variable shall be transformed into a value in the new variable. This type of variable is called a Transformed Variable.
Creating a computed variable
When creating a computed variable, you apply a relatively simple function to the original variable in order to create a new variable that either (a) provides a better way of describing the thing you are actually interested in, or (b) is more closely in agreement with the assumptions of the statistical tests you want to do. Since, at this stage, I have not talked about statistical tests or their assumptions, I will show you an example based on the first case.
Suppose I have run a short study in which I ask 10 people a single question:
On a scale of 1 (strongly disagree) to 7 (strongly agree), to what extent do you agree with the proposition that “Dinosaurs are awesome”?
Now let us load and look at the data. The likert data set contains a single
variable that contains raw Likert-scale responses for these 10 people. However,
if you think about it, this is not the best way to represent these responses.
Because of the fairly symmetric way that we set up the response scale, there is
a sense in which the midpoint of the scale should have been coded as 0 (no
opinion), and the two endpoints should be +3 (strongly agree) and -3
(strongly disagree). By transforming the data in this way it is a bit more
reflective of how we really think about the responses. The transformation is
pretty straightforward, we just subtract 4 from the raw scores. In jamovi you
can do this by computing a new variable: click on the Compute button in the
Data tab and you will see that a new variable has been added to the
spreadsheet. Let us call this new variable likert.centred (go ahead and
type that in) and then add the following in the formula box, like in
Fig. 36: likert.raw - 4
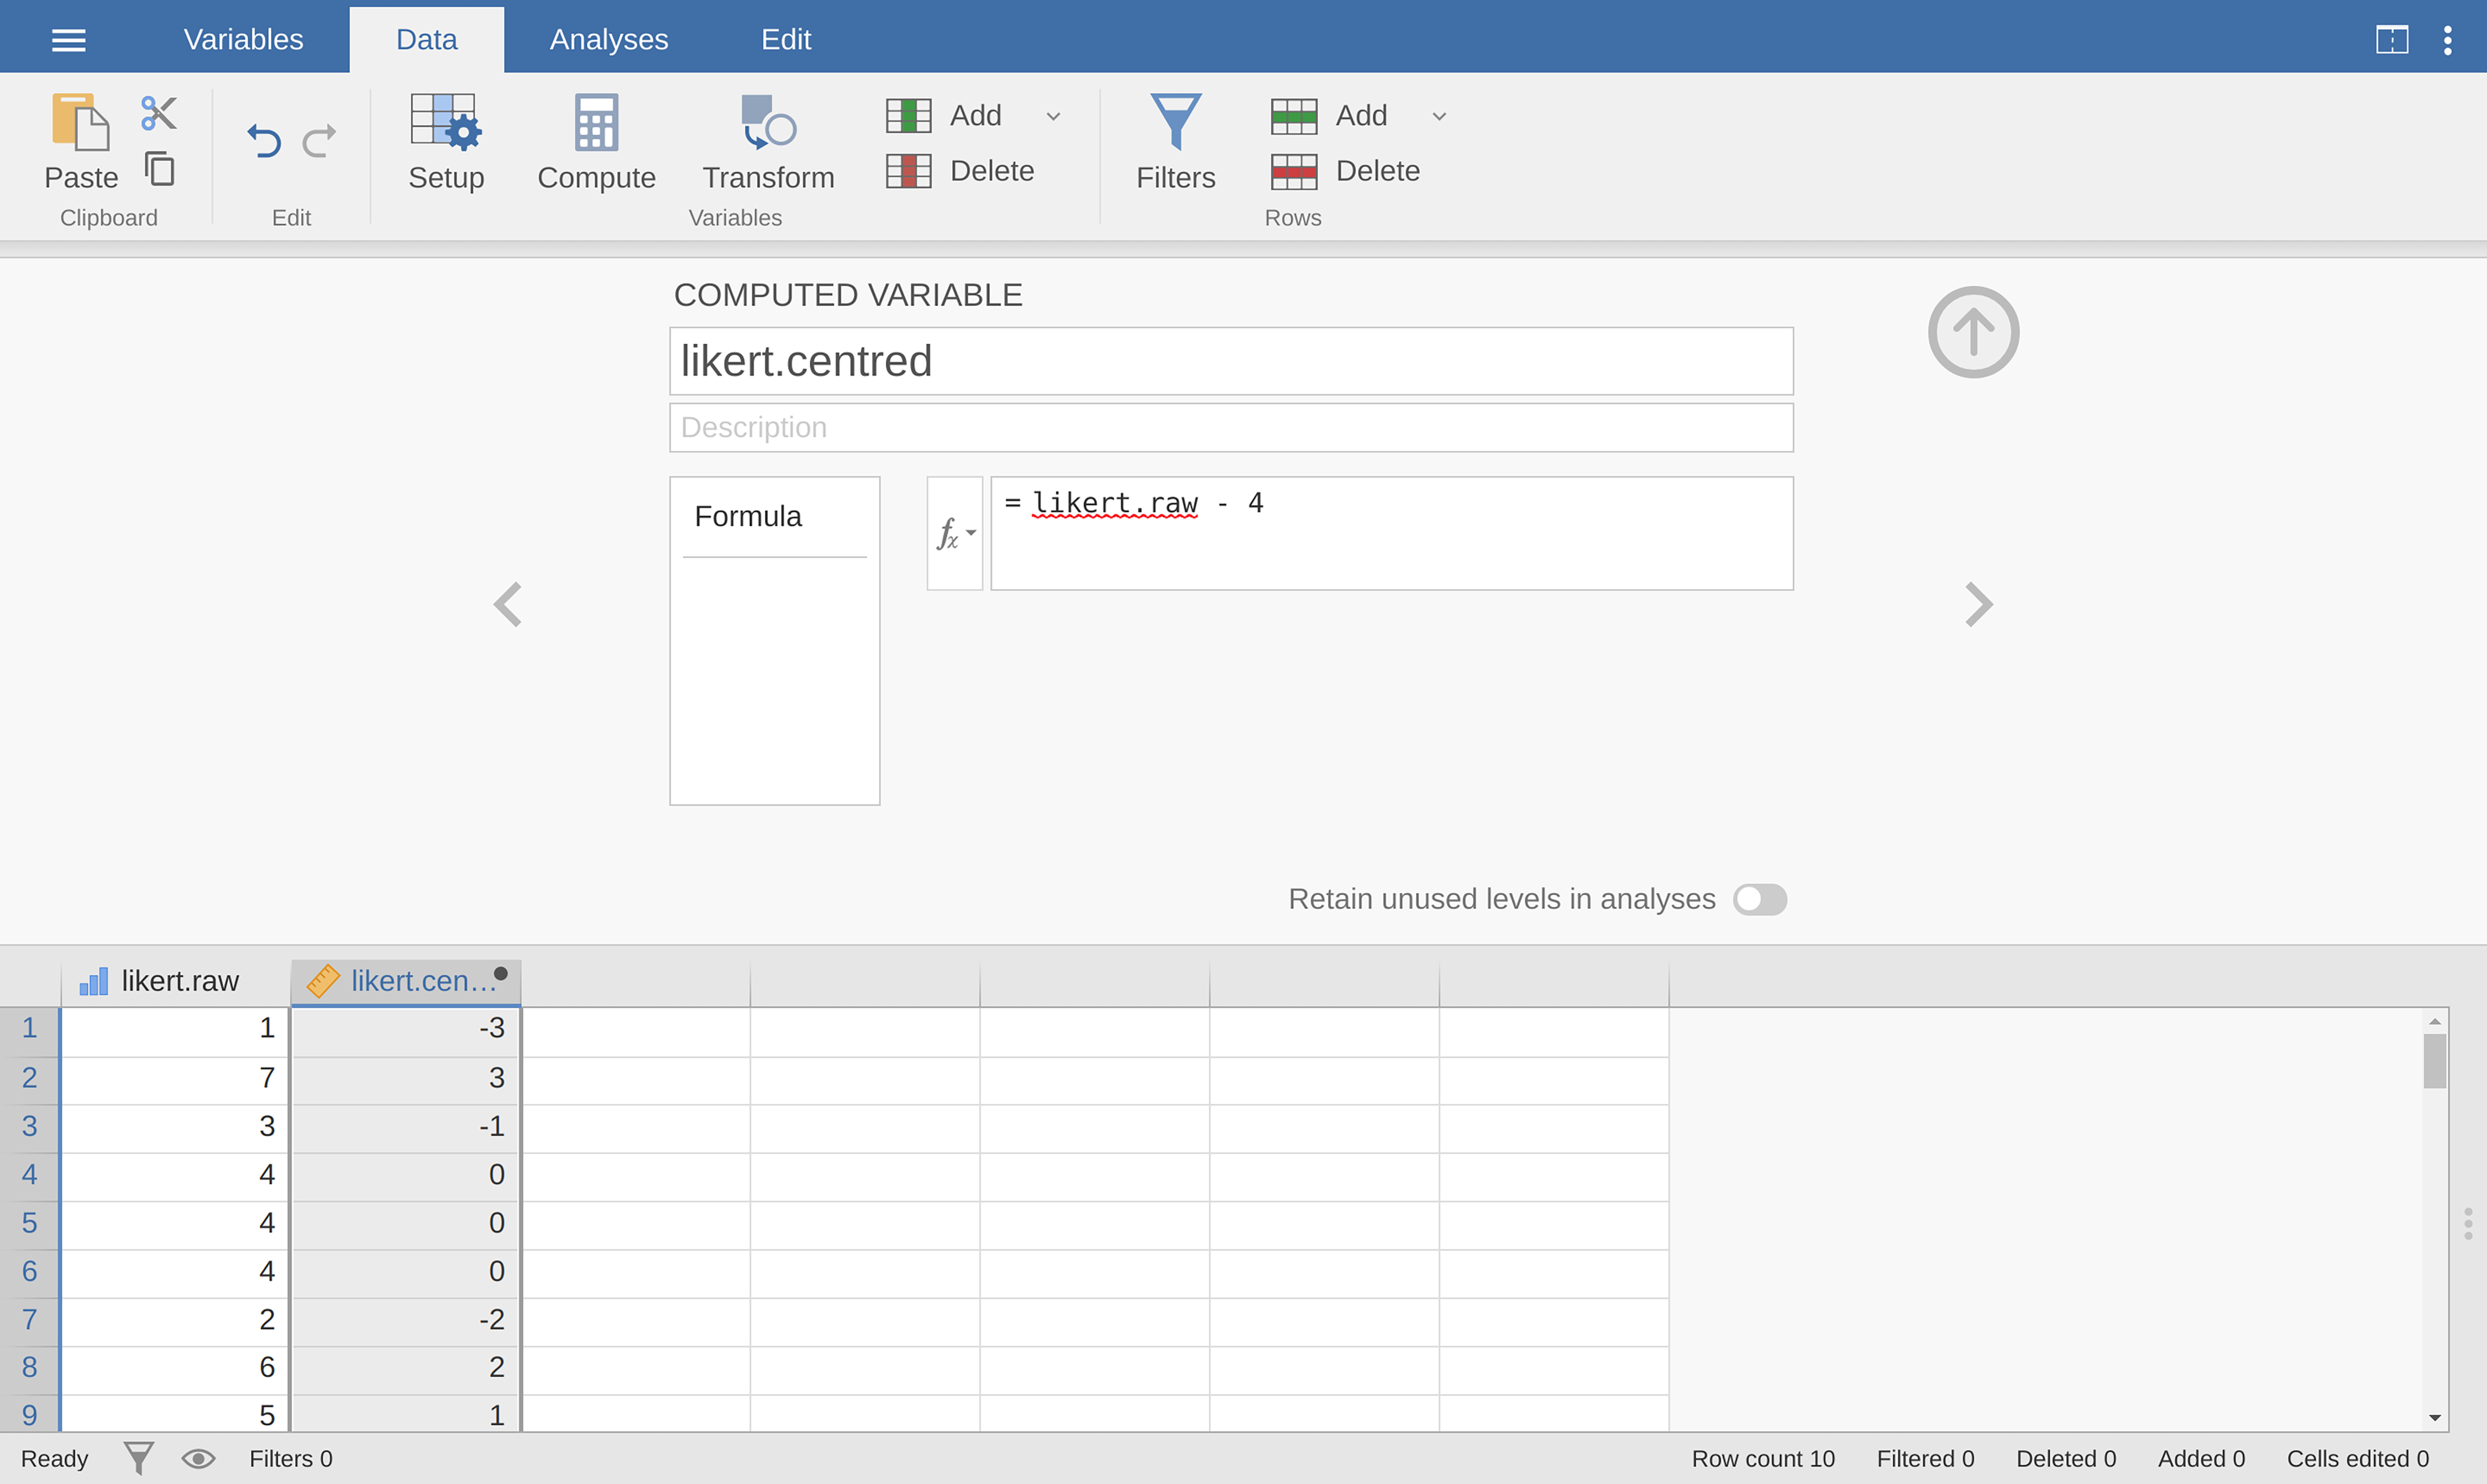
Fig. 36 Creating a new computed variable in jamovi
One reason why it might be useful to have the data in this format is that there
are a lot of situations where you might prefer to analyse the strength of the
opinion separately from the direction of the opinion. We can do two different
transformations on this likert.centred variable in order to distinguish
between these two different concepts. First, to compute an opinion.strength
variable, we want to take the absolute value of the centred data (using the
ABS function).[1] In jamovi, create another new variable using the
Compute button. Name the variable opinion.strength and this time click
on the fx button next to the Formula box. This shows the
different Functions and Variables that you can add to the Formula
box, so double click on ABS and then double click on likert.centred
and you will see that the Formula box is populated with
ABS(likert.centred) and a new variable has been created in the spreadsheet
view, as in Fig. 37:
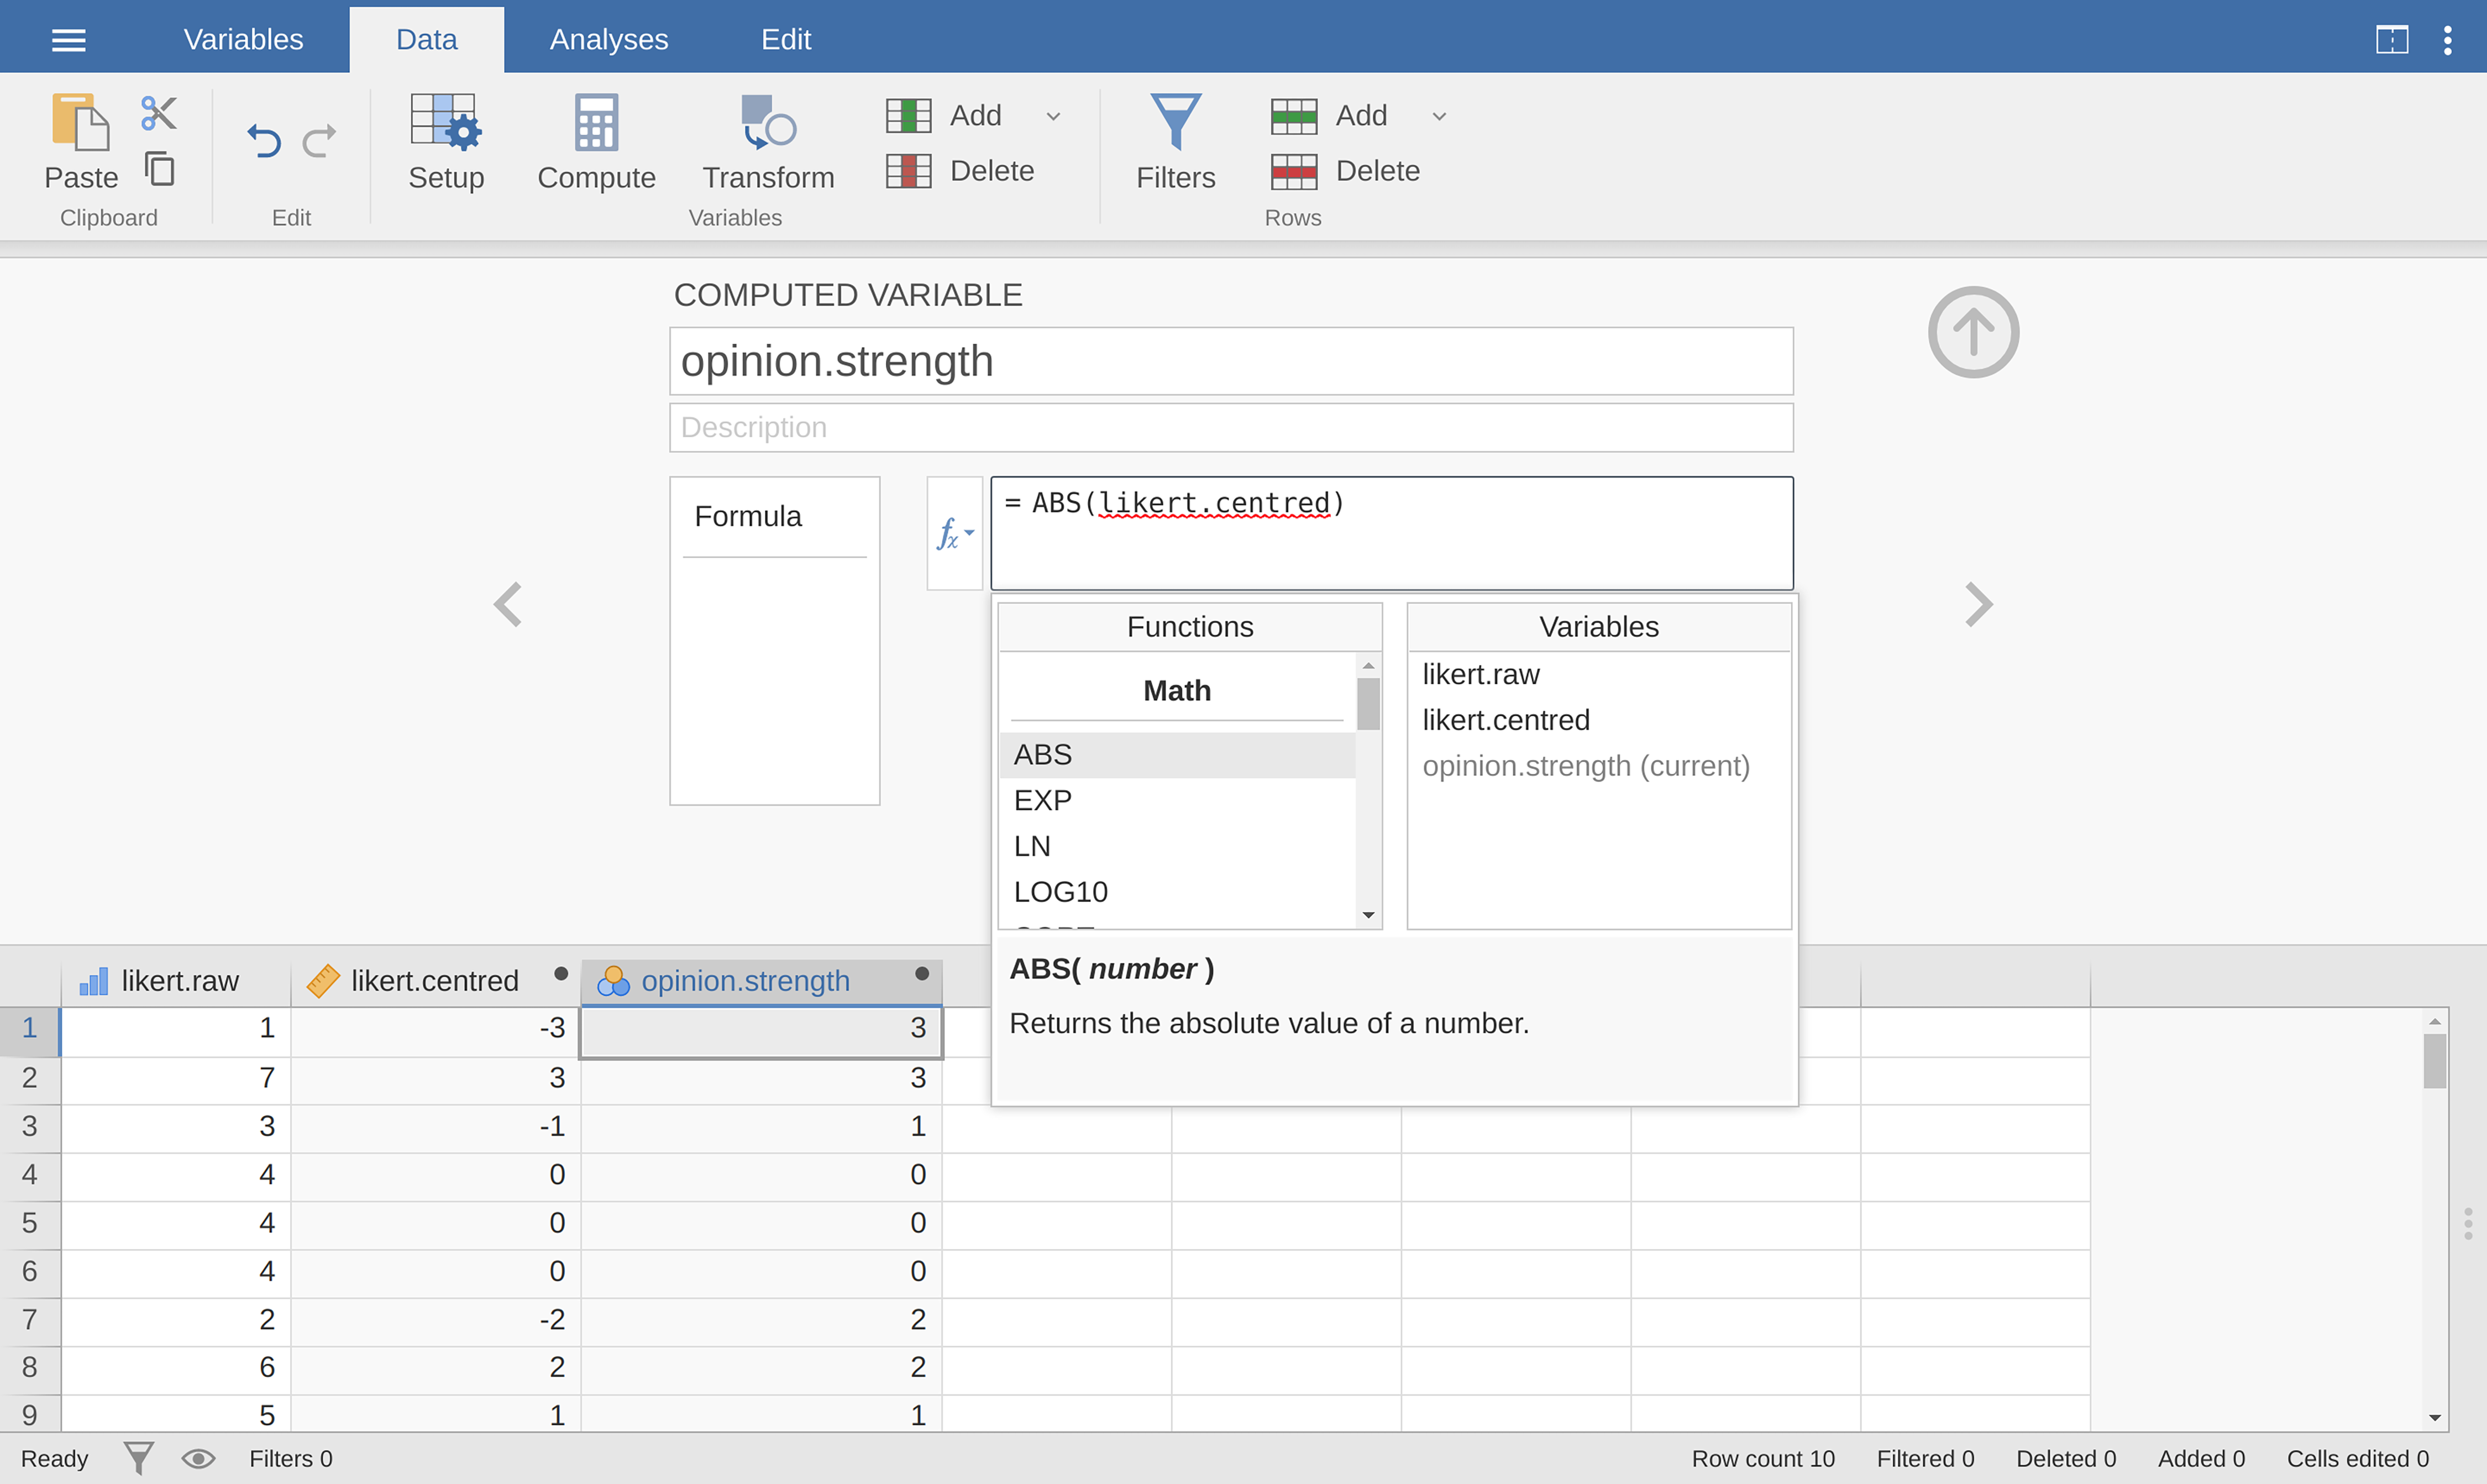
Fig. 37 Using the fx button to select functions and variables
Second, to compute a variable that contains only the direction of the
opinion and ignores the strength, we want to calculate the “sign” of the
variable. In jamovi we can use the IF function to do this. Create
another new variable using the Compute button, name this one
opinion.sign, and then type the following into the function box:
IF(likert.centred == 0, 0, likert.centred / opinion.strength)
When done, you will see that all negative numbers from the
likert.centred variable are converted to -1, all positive
numbers are converted to 1 and zero stays as 0, like so:
-1 1 -1 0 0 0 -1 1 1 1
Let us break down what this IF command is doing. In jamovi there are three
parts to an IF statement, written as IF(expression, value, else). The
first part, expression can be a logical or mathematical statement. In our
example, we have specified likert.centred == 0, which is TRUE for
values where likert.centred is zero. The next part, value, is the new
value where the expression in part one is TRUE. In our example, we have
said that for all those values where likert.centred is zero, keep them
zero. In the next part, else, we can enter another logical or mathematical
statement to be used if part one evaluates to FALSE, i.e. where
likert.centred is not zero. In our example we have divided
likert.centred by opinion.strength to give -1 or +1 depending of
the sign of the original value in likert.centred.[2]
And we are done. We now have three shiny new variables, all of which are useful
transformations of the original likert.raw variable.
One pragmatic task that comes up quite often is the problem of collapsing a variable into a smaller number of discrete levels or categories. For instance, suppose I am interested in looking at the age distribution of people at a social gathering:
60, 58, 24, 26, 34, 42, 31, 30, 33, 2, 9
In some situations it can be quite helpful to group these into a smaller number
of categories. For example, we could group the data into three broad
categories: young (0 - 20), adult (21 - 40) and older (41 - 60). This is a quite
coarse-grained classification, and the labels that I have attached only make
sense in the context of this data set (e.g., viewed more generally, a 42 year
old would not consider themselves as “older”). We can slice this variable up
quite easily using the jamovi IF function that we have already used. This
time we have to specify nested IF statements, meaning simply that IF
the first logical expression is TRUE, insert a first value, but IF a
second logical expression is TRUE, insert a second value, and otherwise
insert a third value. This can be written as:
IF(Age <= 20, 1, IF(Age >= 21 and Age <= 40, 2, 3))
Note that there are two left parentheses used during the nesting, so the whole statement has to end with two right parentheses otherwise you will get an error message. The jamovi screen shot for this data manipulation, along with an accompanying frequency table, is shown in Fig. 38:
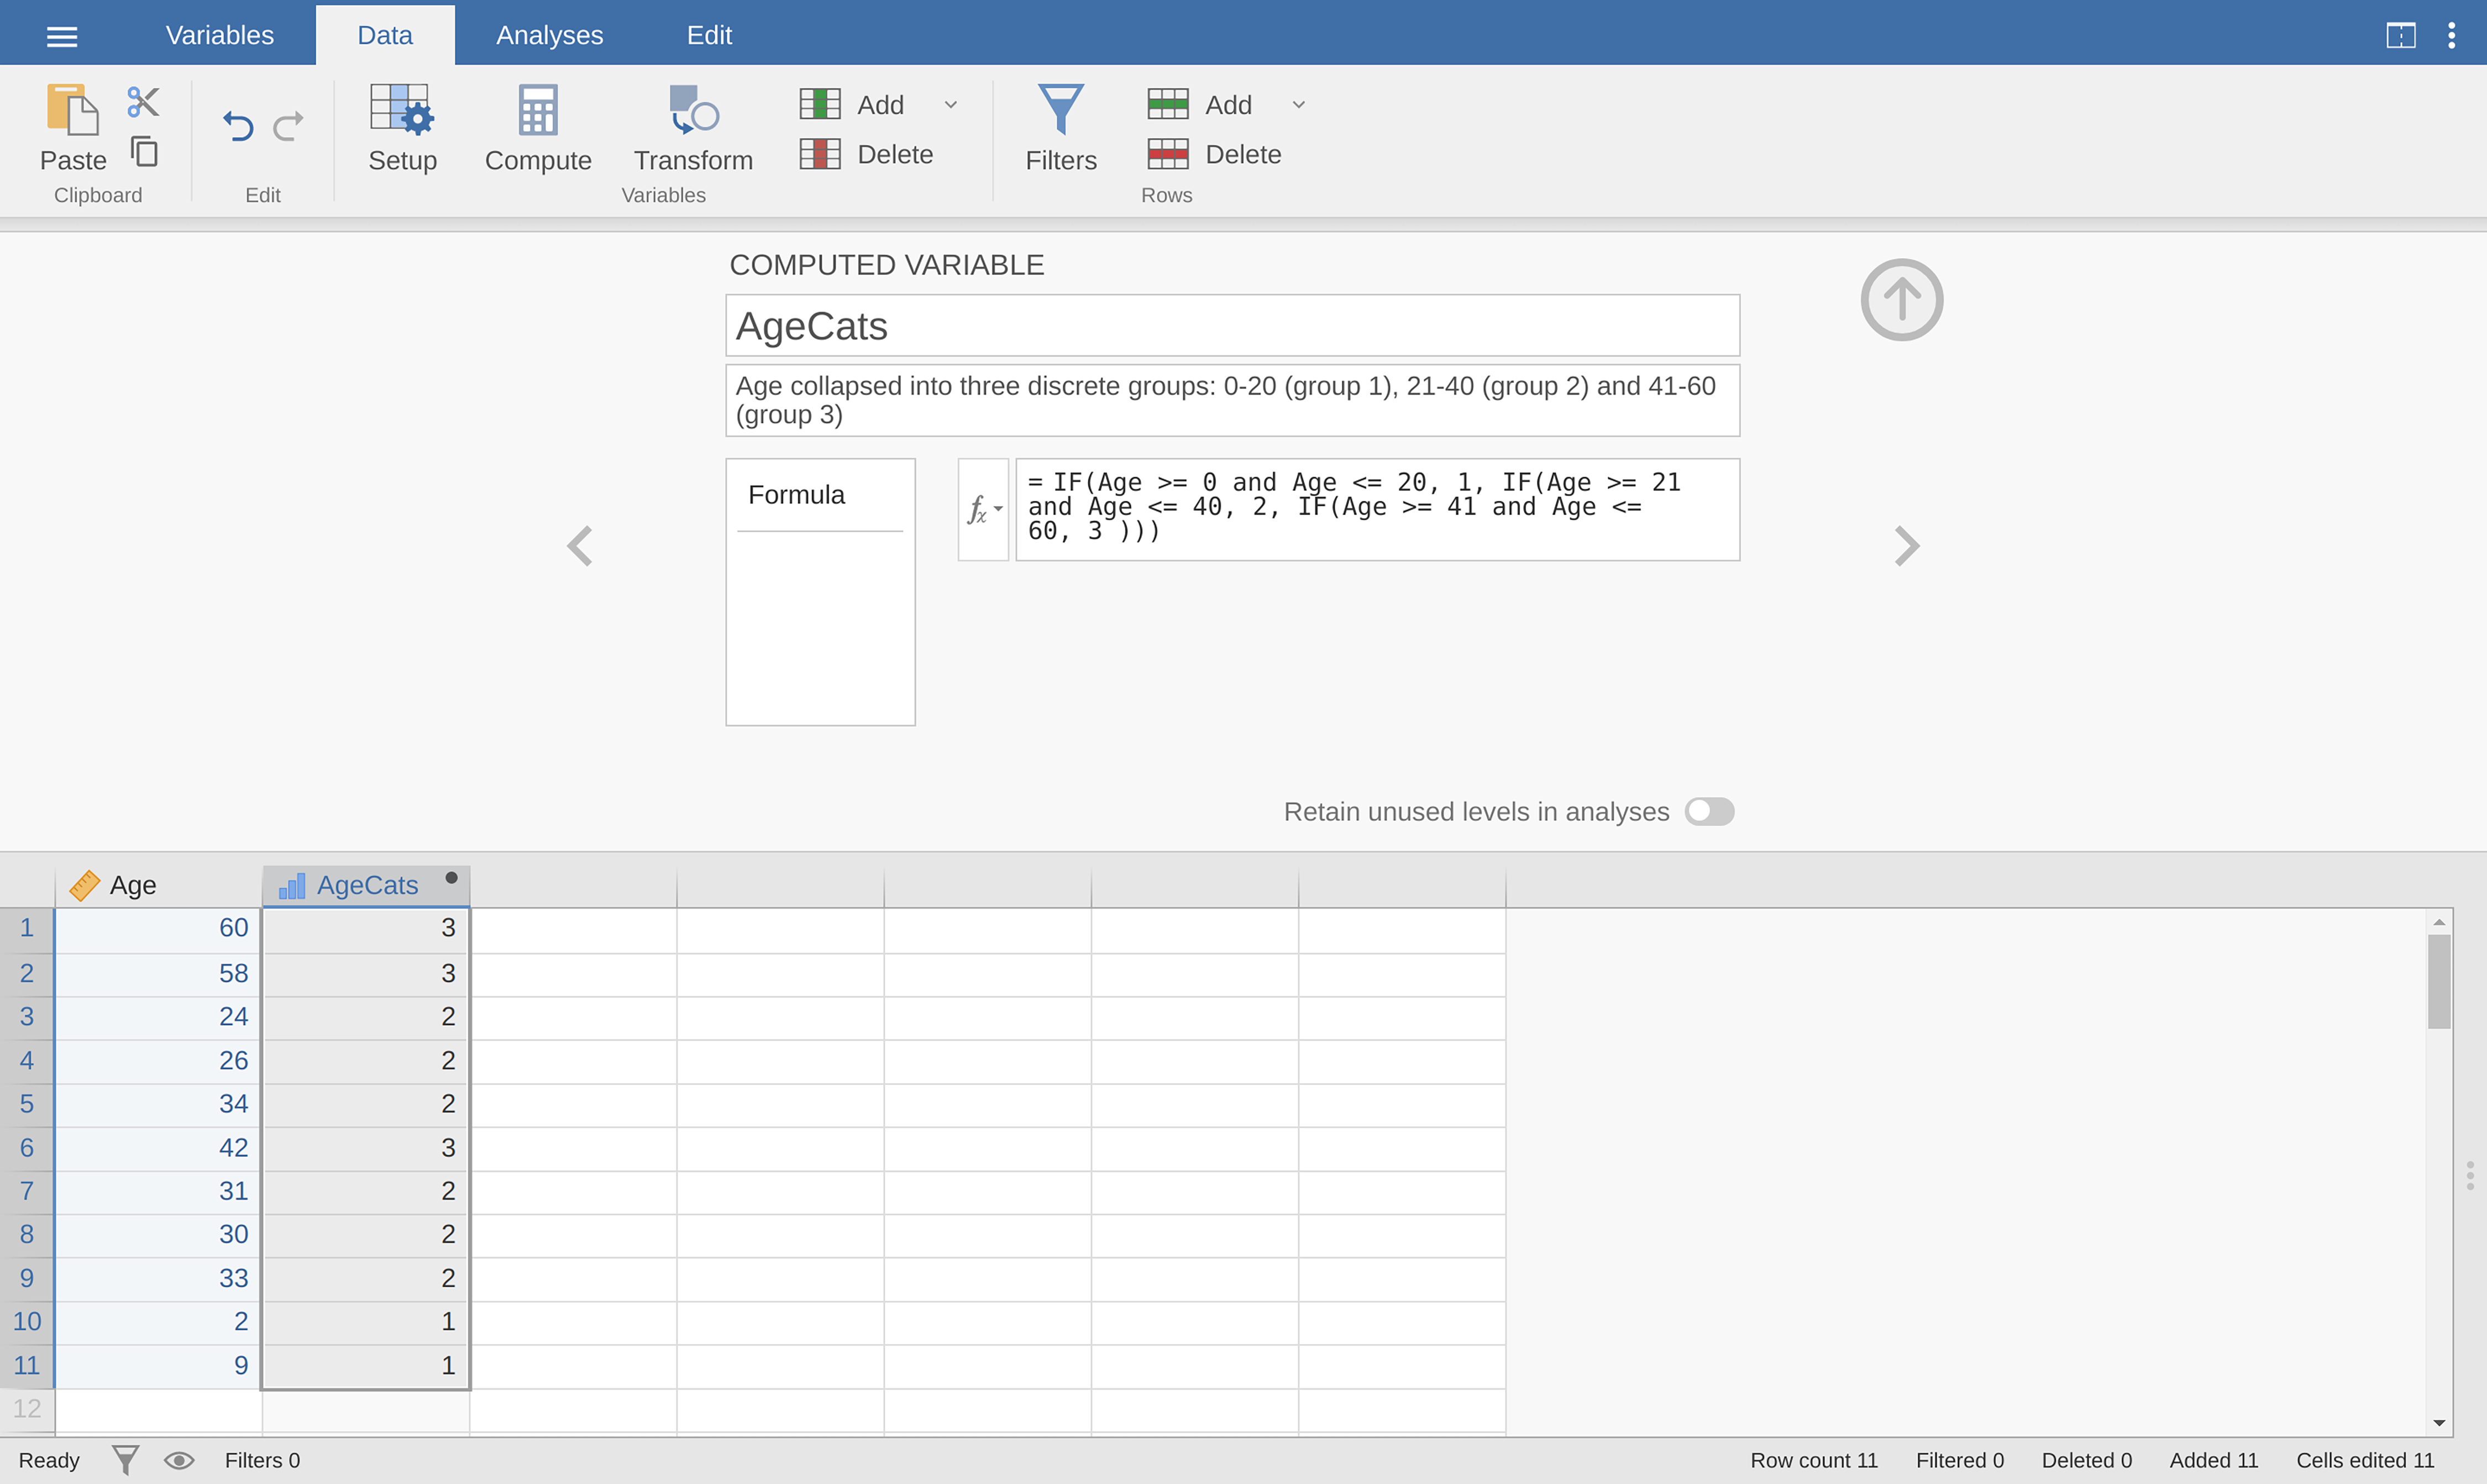
Fig. 38 Collapsing a variable into a smaller number of discrete levels using the
jamovi IF function
It is important to take the time to figure out whether or not the resulting categories make any sense at all in terms of your research project. If they do not make any sense to you as meaningful categories, then any data analysis that uses those categories is likely to be just as meaningless. More generally, in practice I have noticed that people have a very strong desire to carve their (continuous and messy) data into a few (discrete and simple) categories, and then run analyses using the categorised data instead of the original data.[3] I would not go so far as to say that this is an inherently bad idea, but it does have some fairly serious drawbacks at times, so I would advise some caution if you are thinking about doing it.
Creating a transformation that can be applied to multiple variables
Sometimes you want to apply the same transformation to more than one variable,
for example when you have multiple questionnaire items that all need to be
recalculated or recoded in the same way. And one of the neat features in
jamovi is that you can create a transformation, using the Transform button
in the Data tab, that can then be saved and applied to multiple variables.
Let us go back to the first example above, using the likert data set that
contains a single variable with raw Likert-scale responses for 10 people. To
create a transformation that you can save and then apply across multiple
variables (assuming you had more variables like this in your data file), first
in the spreadsheet editor select (i.e., click) the variable you want to use to
initially create the transformation. In our example this is likert.raw. To
create a transformed variable, click the
Transform button in the jamovi Data tab, and you will see something
like Fig. 39.
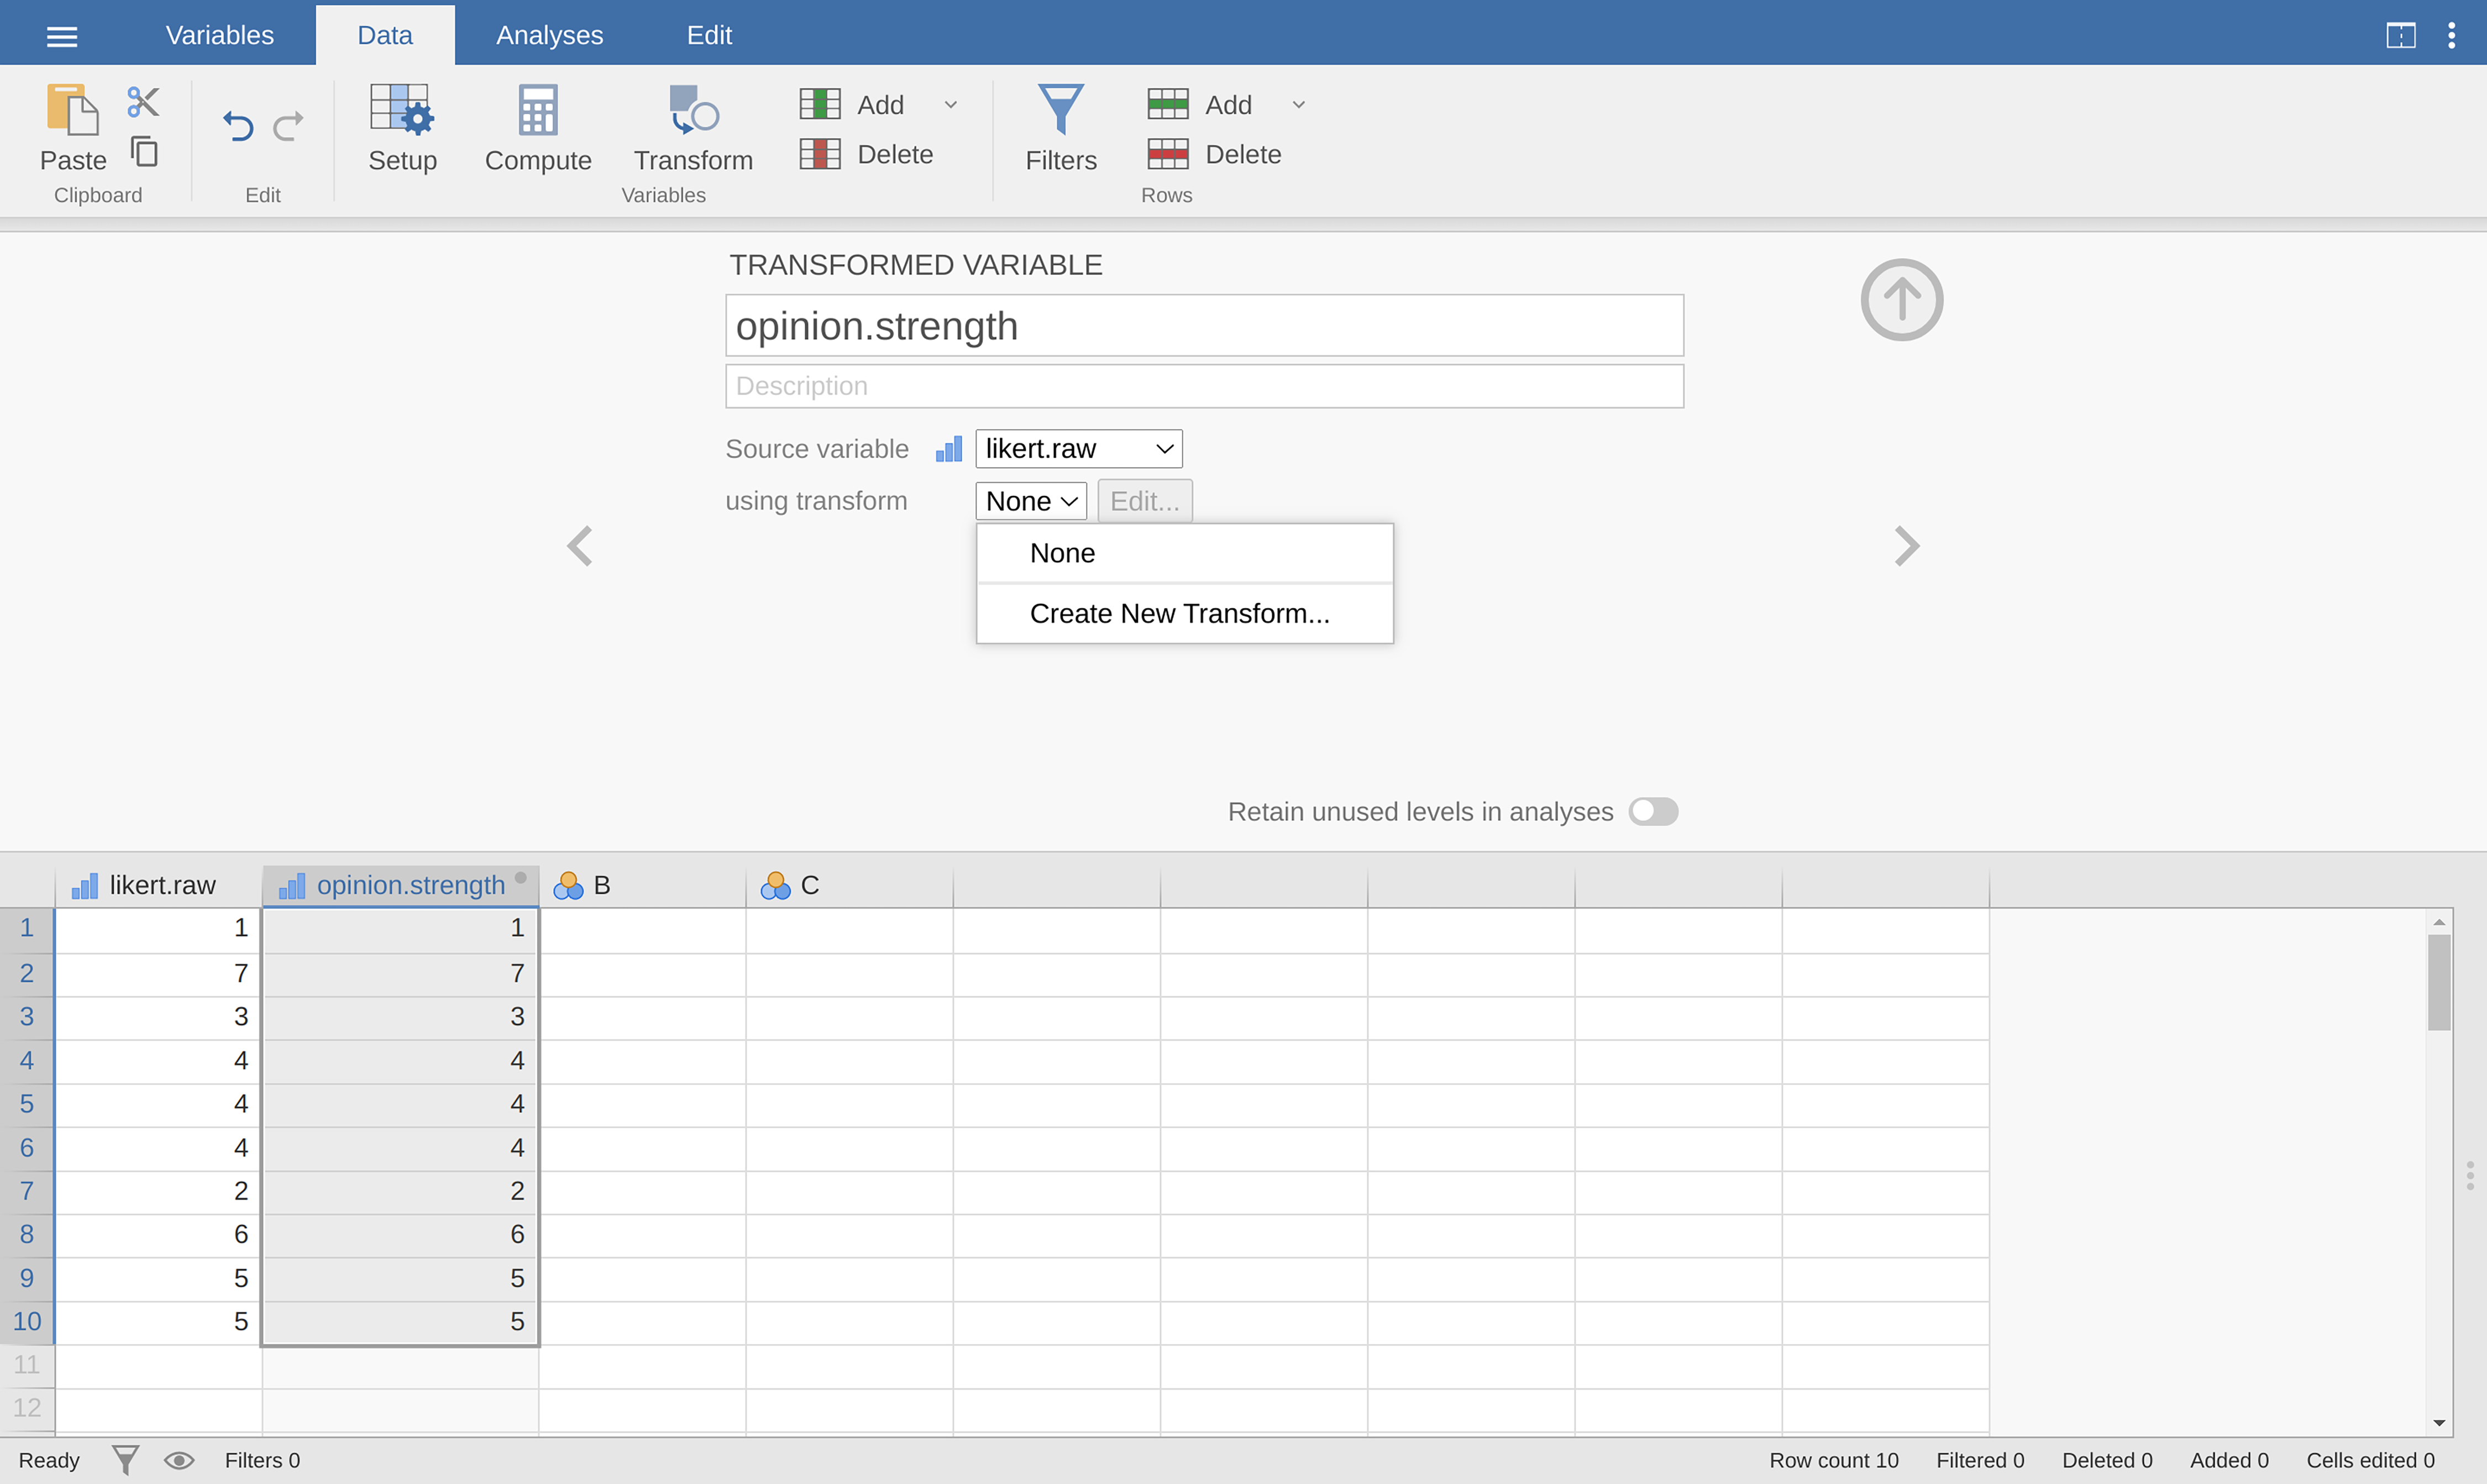
Fig. 39 Creating a new variable transformation using the jamovi Transform
command
Give your new variable a name, let us call it opinion.strength and then
click on the Using transform selection box and select Create New
Transform…. This is where you will create, and name, the transformation that
can be re-applied to as many variables as you like. The transformation is
automatically named for us as Transform 1 (imaginative, but you can change
this if you like). Then type the expression ABS($source - 4) into the
function text box, as in Fig. 40, press Enter or Return on your
keyboard and you have created a new transformation and applied it to the
likert.raw variable! Note that instead of using the variable label in the
expression, we have instead used $source. This is so that we can then use
the same transformation with as many different variables as we like – jamovi
requires you to use $source to refer to the source variable you are
transforming. Your transformation has also been saved and can be re-used any
time you like (providing you save the dataset as an .omv file, otherwise
you will lose it!).
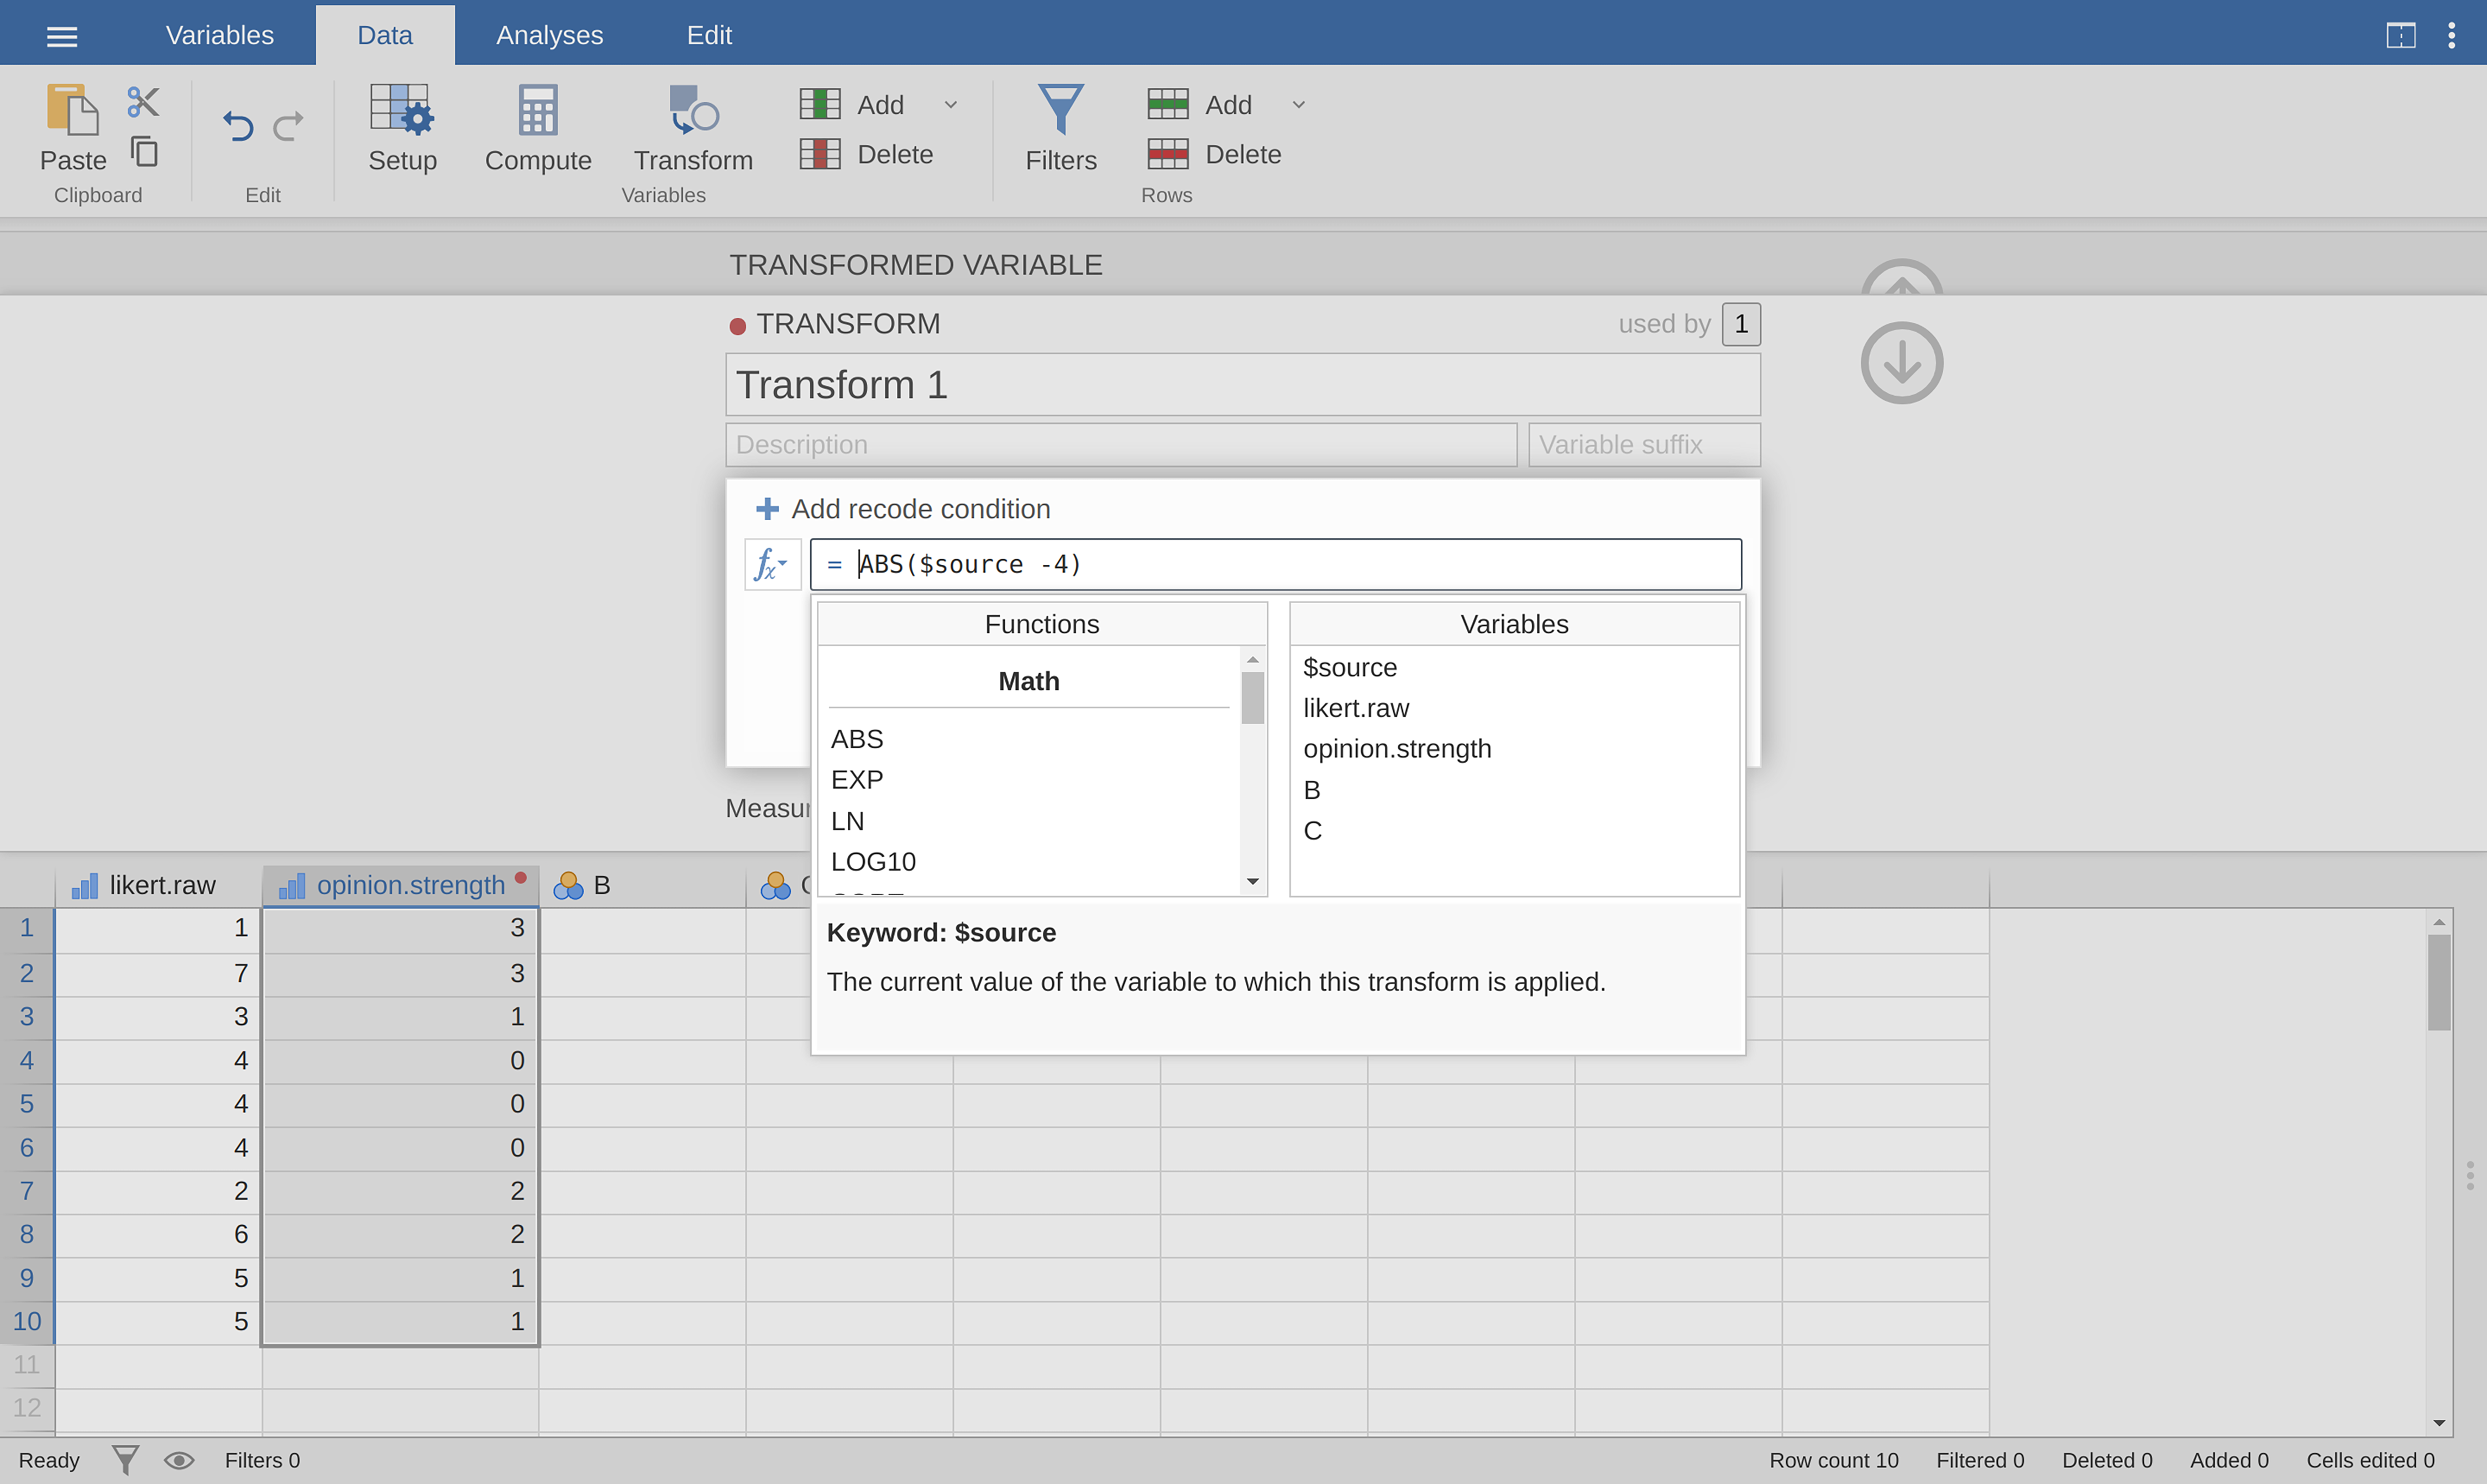
Fig. 40 Specifying a transformation in jamovi, to be saved as the imaginatively
named Transform 1
You can also create a transformation with the second example we looked at, the
age distribution of people at a social gathering. Go on, you know you want to!
Remember that we collapsed this variable into three groups: younger, adult and
older. This time we will achieve the same thing, but using the jamovi
Transform → Add condition button. With this data set (go back to it or
create it again if you did not save it) set up a new variable transformation.
Call the transformed variable AgeCats and the transformation you will
create Agegroupings. Then click on the big + sign next to the function
box. This is the Add condition button and I have stuck a big red arrow onto
Fig. 41 so you can see exactly where this is. Re-create the
transformation shown in Fig. 41 and when you have done, you will see
the new values appear in the spreadsheet window. What is more, the
Agegroupings transformation has been saved and can be re-applied any time
you like. Ok, so I know that it is unlikely you will have more than one Age
variable, but you get the idea now of how to set up transformations in jamovi,
so you can follow this idea with other sorts of variables. A typical scenario
for this is when you have a questionnaire scale with, say, 20 items (variables)
and each item was originally scored from 1 to 6 but, for some reason or quirk
of the data you decide to recode all the items as 1 to 3. You can easily do
this in jamovi by creating and then re-applying your transformation for each
variable that you want to recode.
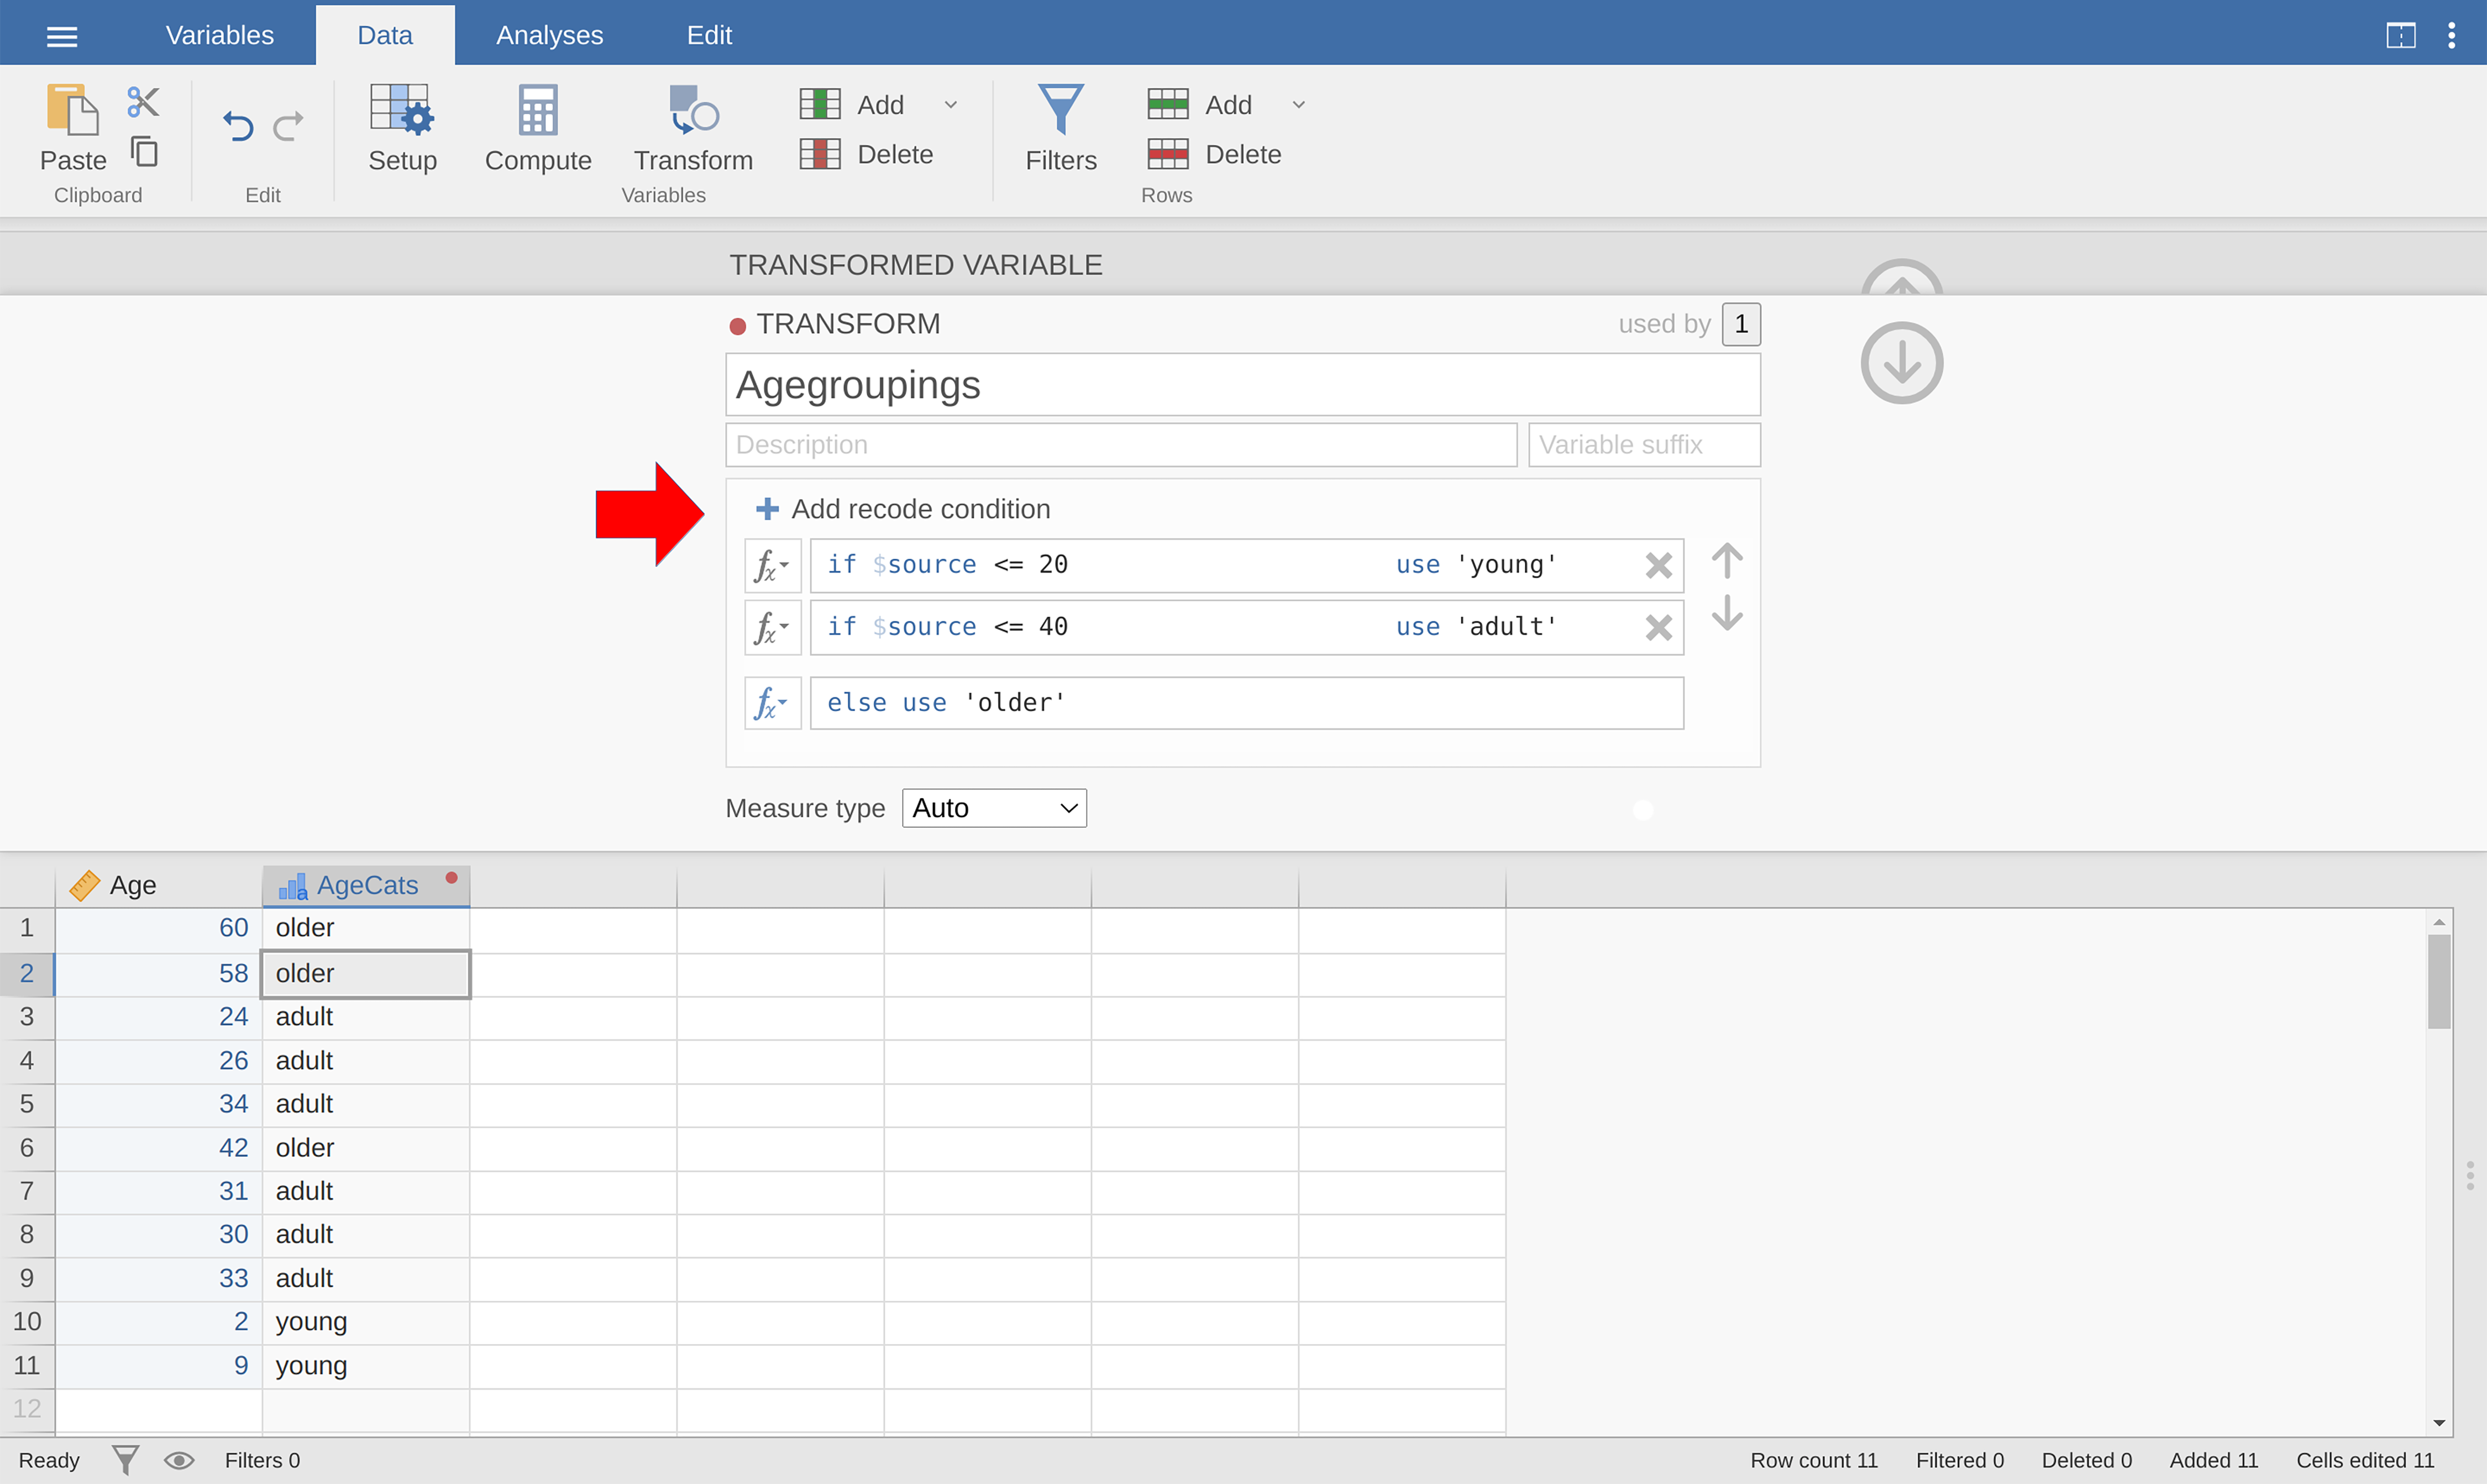
Fig. 41 jamovi transformation into three age categories, using the Add
condition button