Auteur de la section : Danielle J. Navarro and David R. Foxcroft
Descriptive statistics
Any time that you get a new data set to look at one of the first tasks that you
have to do is find ways of summarising the data in a compact, easily understood
fashion. This is what descriptive statistics (as opposed to inferential
statistics) is all about. In fact, to many people the term “statistics” is
synonymous with descriptive statistics. It is this topic that we will consider
in this chapter, but before going into any details, let us take a moment to get
a sense of why we need descriptive statistics. To do this, let us open the
aflsmall_margins data set and see what variables are stored in the file
(Fig. 20).
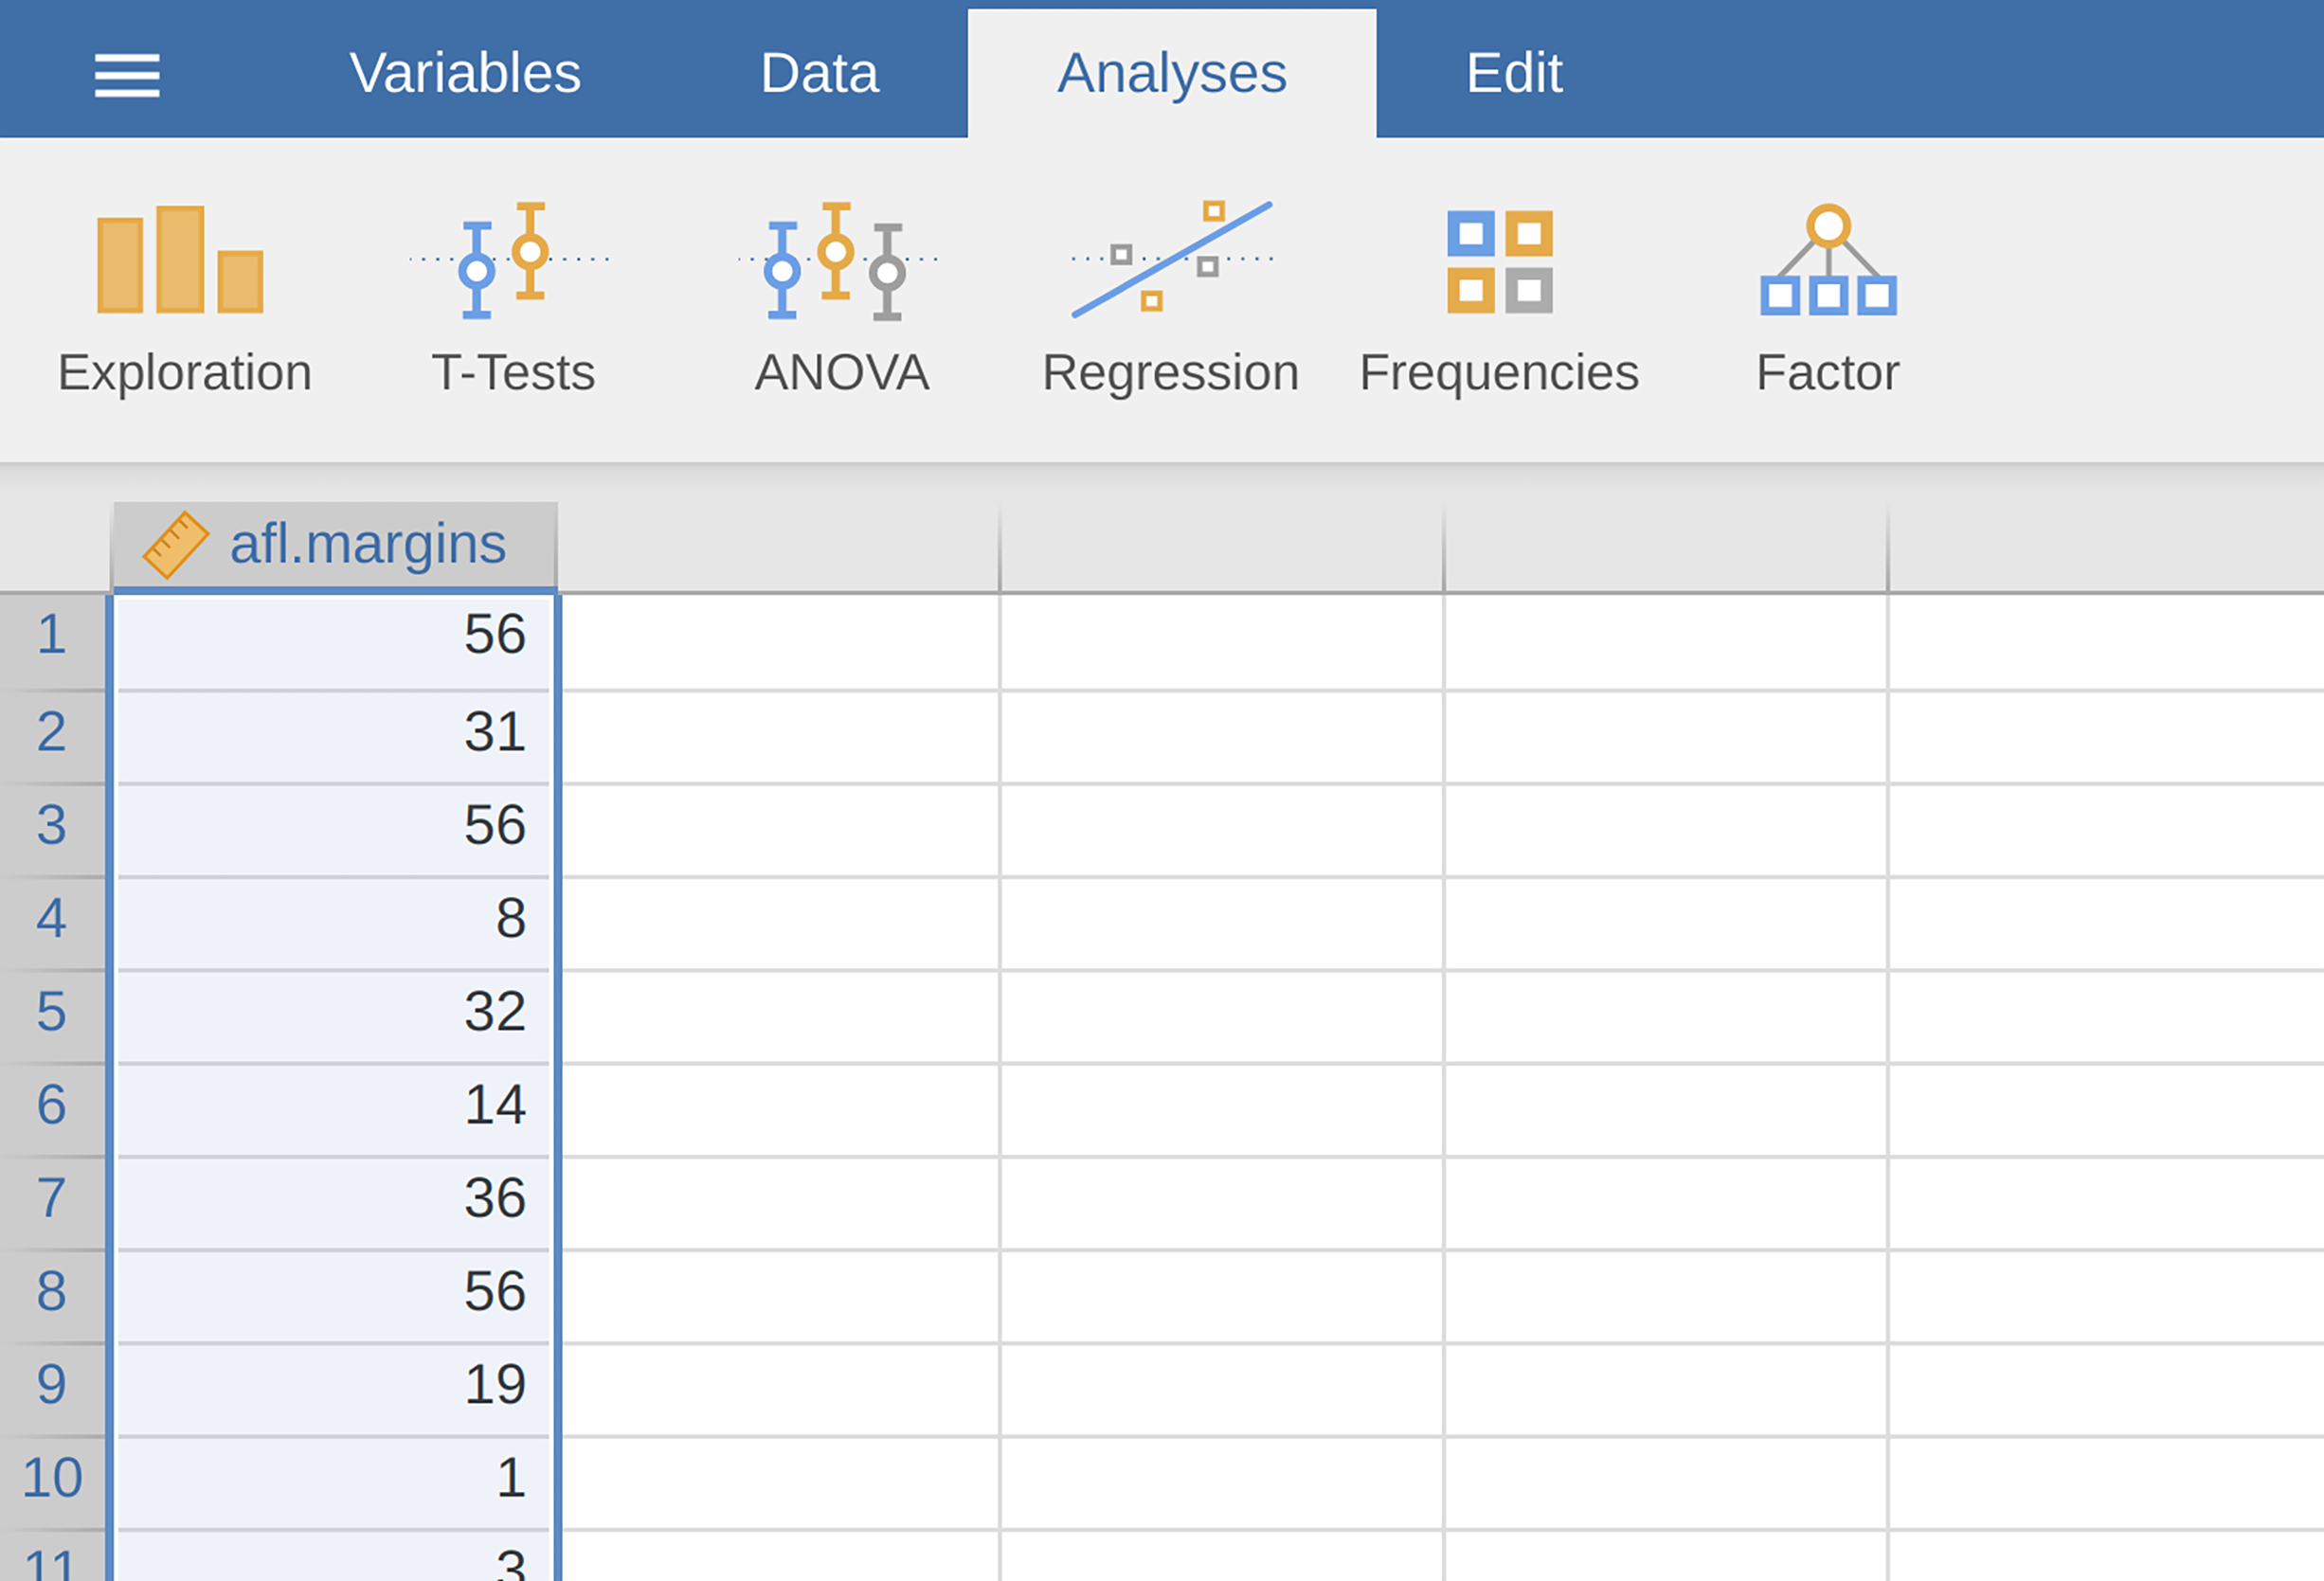
Fig. 20 Screenshot of jamovi showing the variables in the aflsmall_margins
data set
In fact, there is just one variable here, afl.margins. We will focus a bit
on this variable in this chapter, so I should better tell you what it is.
Unlike most of the data sets in this book, this is actually real data, relating
to the Australian Football League (AFL).[1] The afl.margins variable
contains the winning margin (number of points) for all 176 home and away games
played during the 2010 season.
This output does not make it easy to get a sense of what the data are actually
saying. Just “looking at the data” is not a terribly effective way of
understanding data. In order to get some idea about what the data are actually
saying we need to calculate some descriptive statistics (this chapter) and draw
some nice pictures (chapter Drawing graphs). Since the
descriptive statistics are the easier of the two topics I will start with
those, but nevertheless I will show you a histogram of the afl.margins
variable since it should help you get a sense of what the data we are trying to
describe actually look like, see Fig. 21. We will talk a lot more
about how to draw histograms. For now, it is
enough to look at the histogram and note that it provides a fairly
interpretable representation of the afl.margins variable.
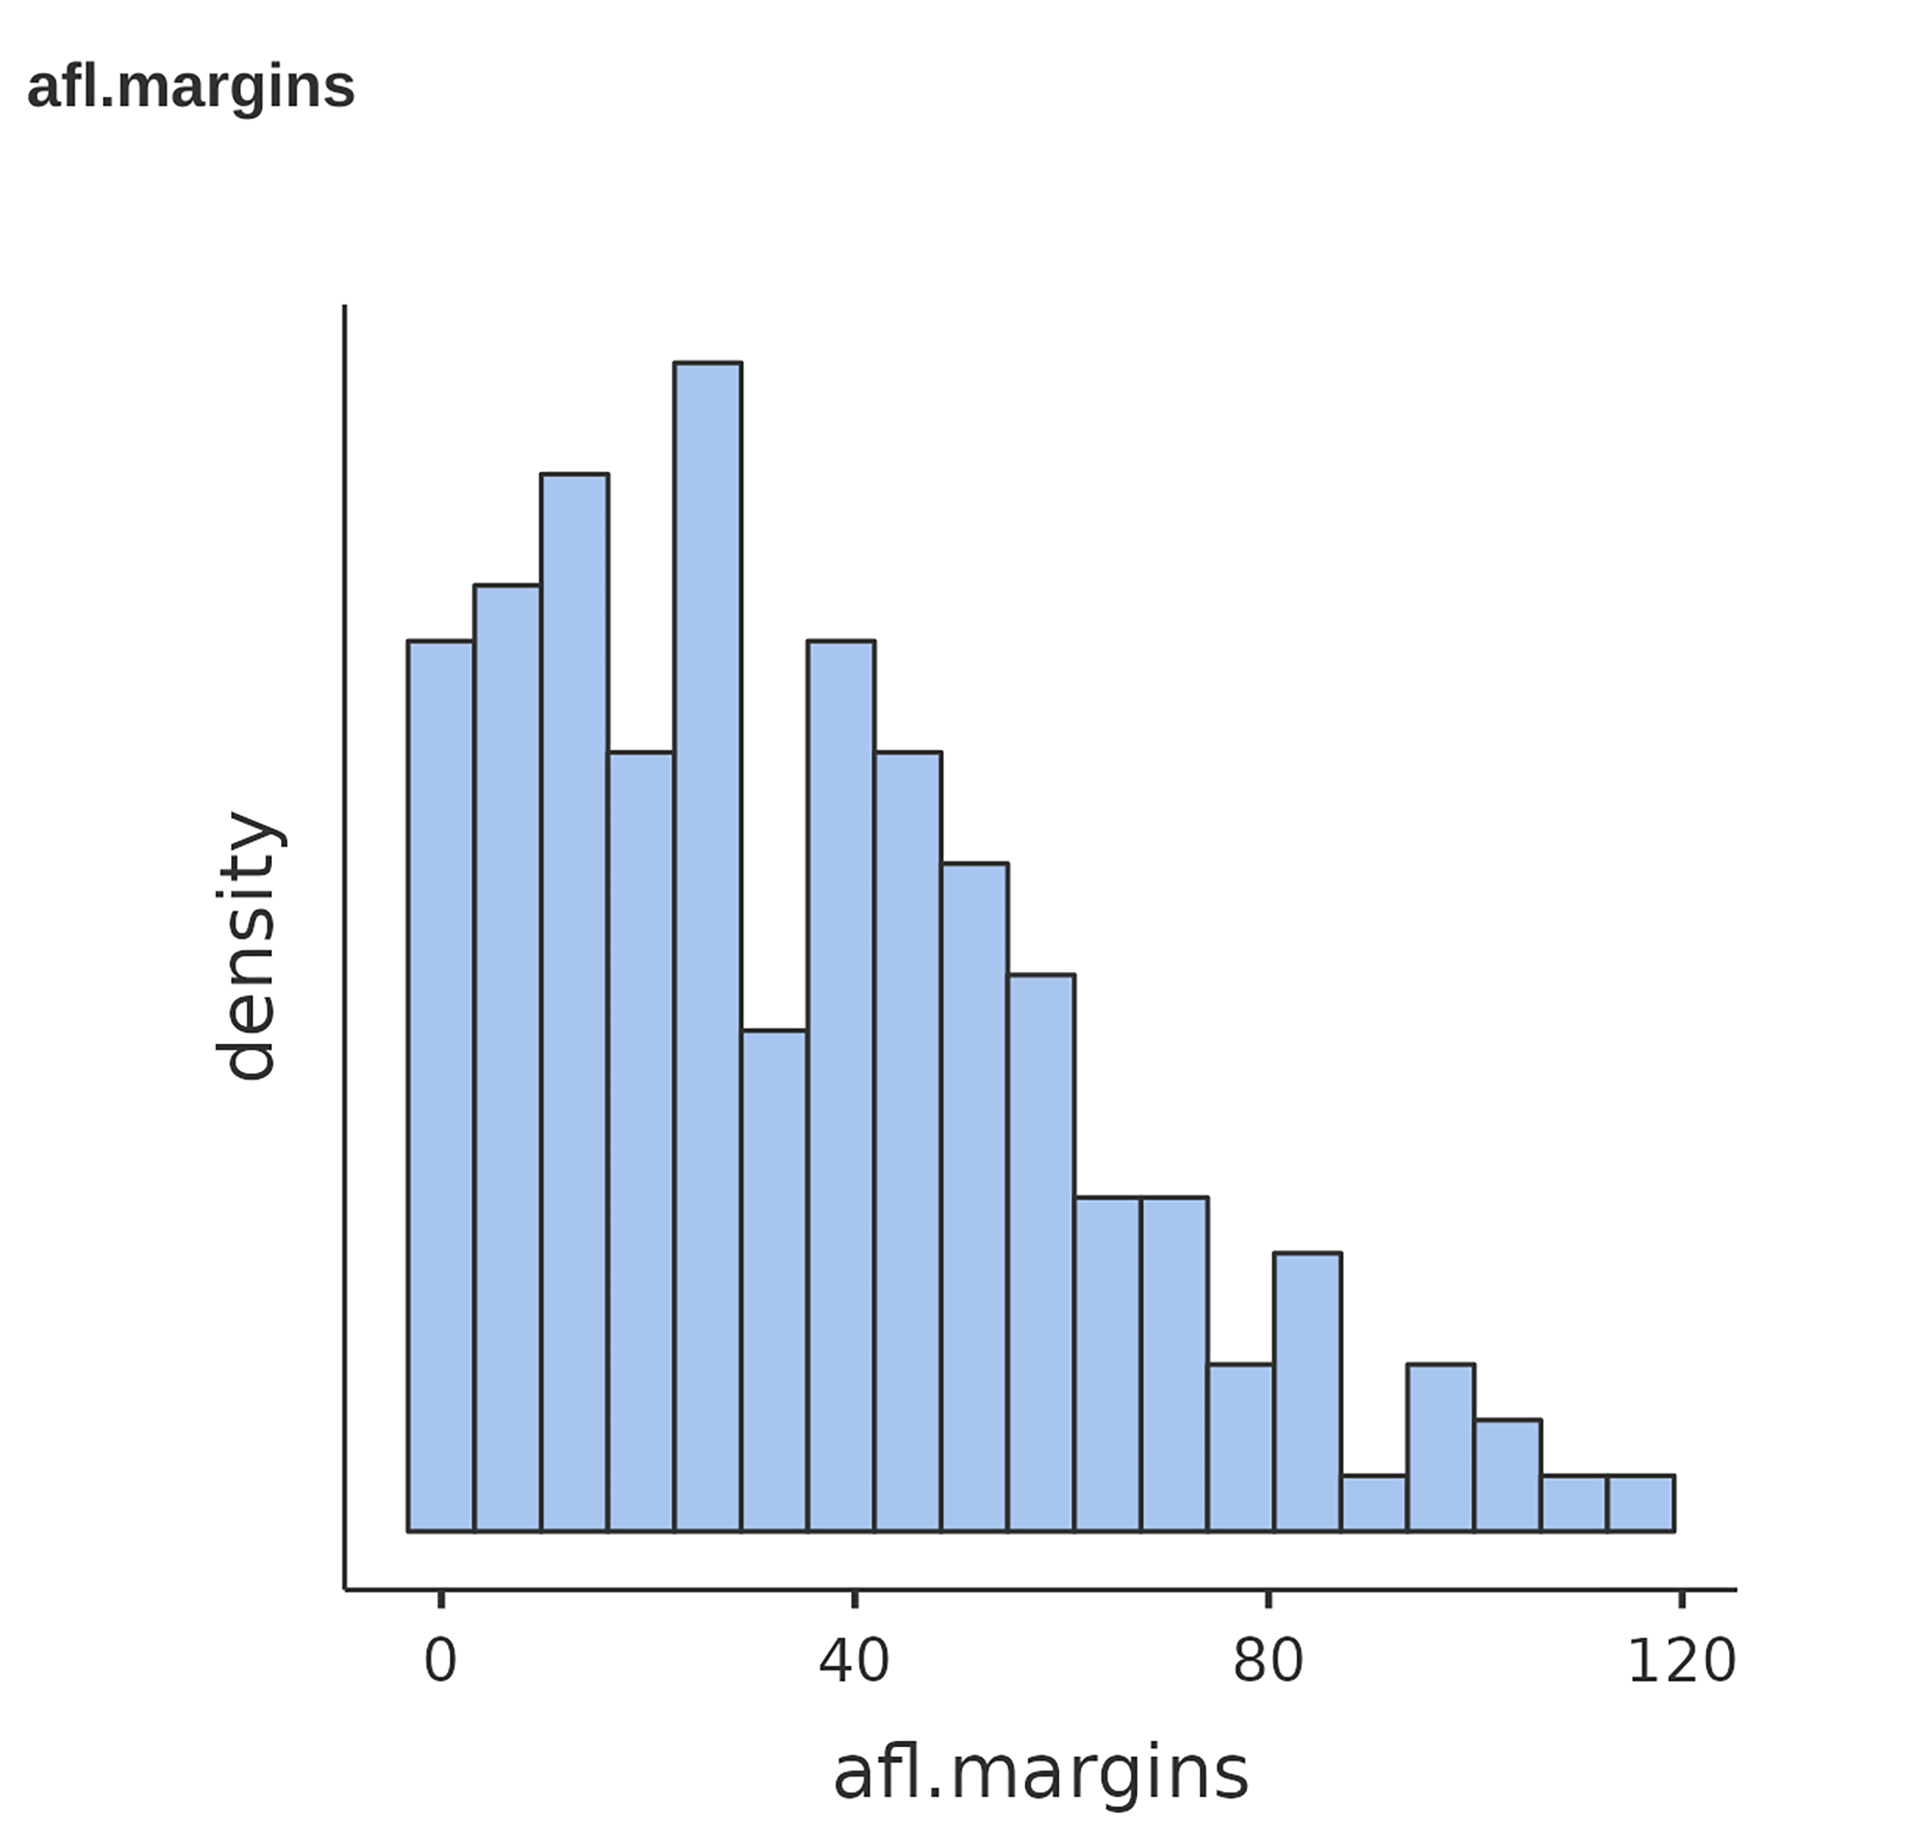
Fig. 21 Histogram of the AFL 2010 winning margin data (the afl.margins
variable). As you might expect, the larger the winning margin the less
frequently you tend to see it.