Auteur de la section : Danielle J. Navarro and David R. Foxcroft
Drawing graphs
Above all else show the data.—Edward Tufte[1]
Visualising data is one of the most important tasks facing the data analyst. It is important for two reasons. First, for drawing “presentation graphics” – displaying your data in a clean, visually appealing way makes it easier for your readers to understand what you are trying to tell them. Second, and perhaps more important, is the fact that drawing graphs helps you to understand the data. To that end, it is important to draw “exploratory graphics” that help you learn about the data as part of your analysis.
To give a sense of the importance of this chapter, I want to start with a classic illustration of just how powerful a good graph can be. Fig. 32 is a redrawing of one of the most famous data visualisations of all time – John Snow’s 1854 map of cholera deaths. The map is elegant in its simplicity. A street map helps orient the viewer, overlayed with a large number of small orange squares, each one representing the location of a cholera case. The larger blue dots show the location of water pumps, labelled by name. Even the most casual inspection of the graph makes it very clear that the source of the outbreak is almost certainly the Broad Street pump. Upon viewing this graph Dr Snow arranged to have the handle removed from the pump, thus ending the outbreak that had killed over 500 people. Such is the power of a good data visualisation.
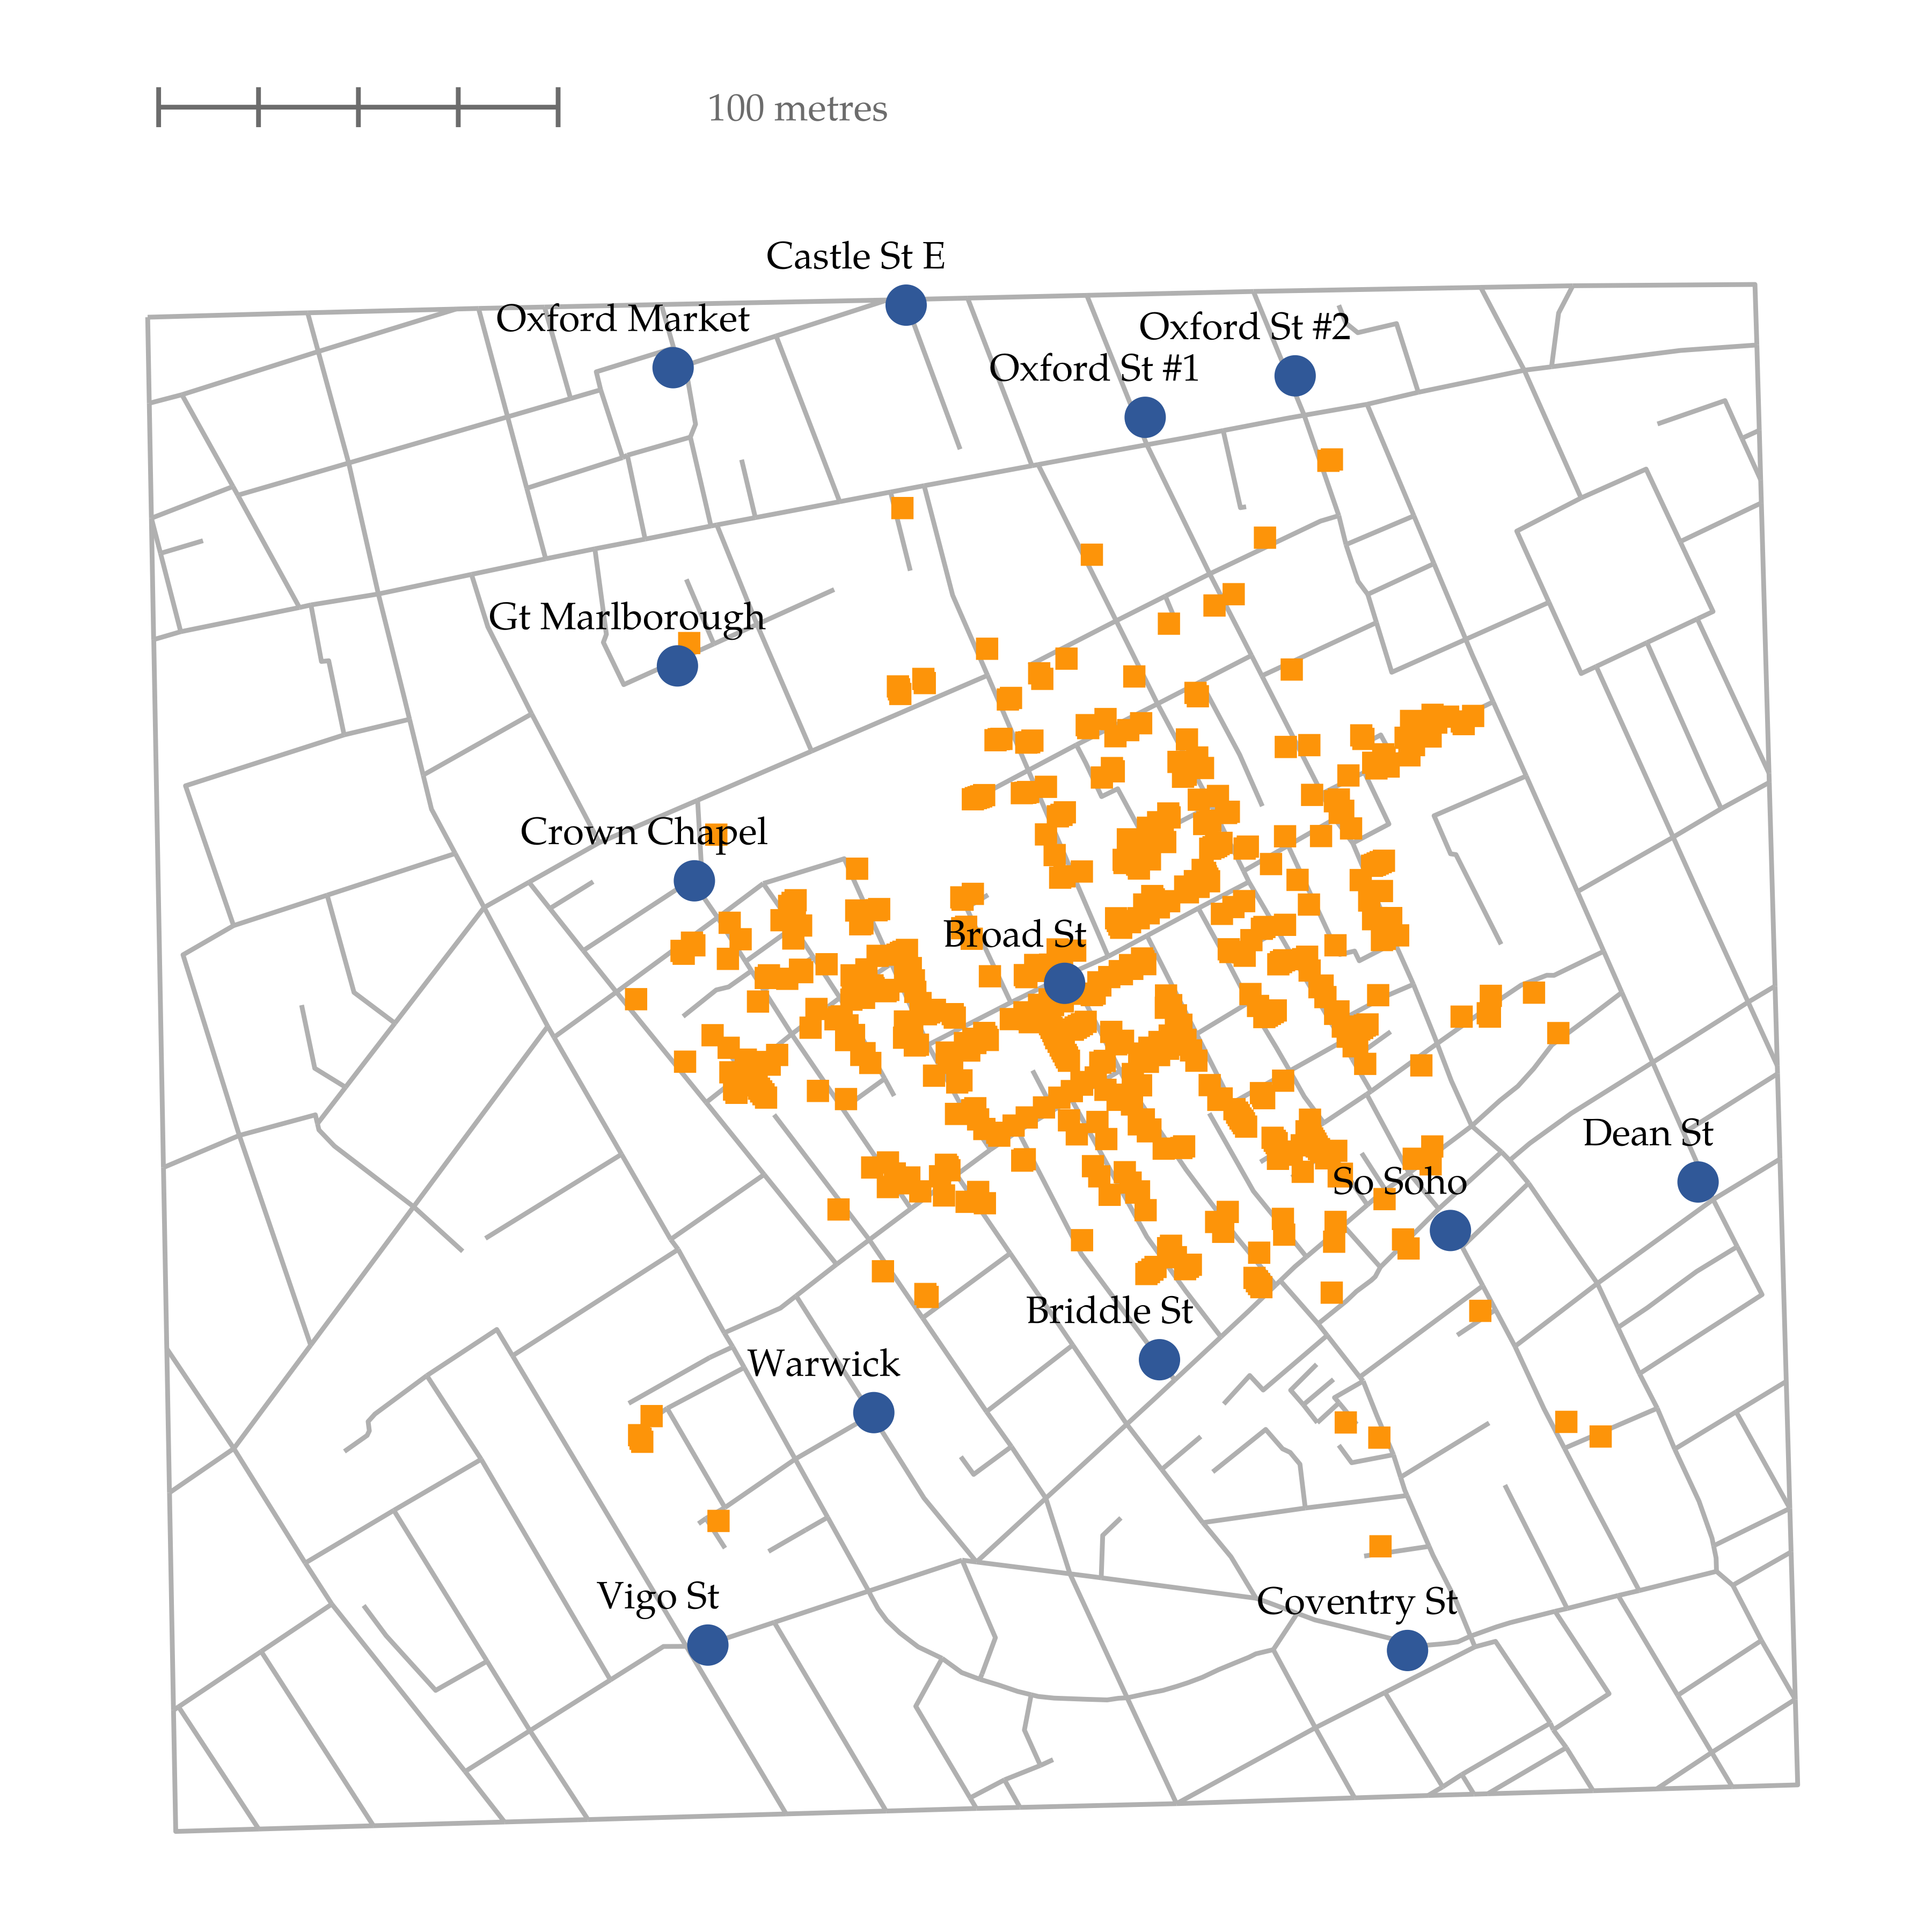
Fig. 32 A stylised redrawing of John Snow’s original cholera map of London. Each small orange square represents the location of a cholera death and each blue circle shows the location of a water pump. As the plot makes clear, the cholera outbreak is centred very closely on the Broad St pump.
There are two goals in this chapter. First, to discuss several fairly standard graphs that we use a lot when analysing and presenting data, and second to show you how to create these graphs in jamovi. The graphs themselves tend to be pretty straightforward, so in one respect this chapter is pretty simple. Where people usually struggle is learning how to produce graphs, and especially learning how to produce good graphs. Fortunately, learning how to draw graphs in jamovi is reasonably simple as long as you are not too picky about what your graph looks like. What I mean when I say this is that jamovi has a lot of very good default graphs, or plots, that most of the time produce a clean, high-quality graphic. However, on those occasions when you do want to do something non-standard, or if you need to make highly specific changes to the figure, then the graphics functionality in jamovi is not yet capable of supporting advanced work or detail editing.