Auteur de la section : Danielle J. Navarro and David R. Foxcroft
Bayesian t-tests
An important type of statistical inference problem discussed in this book is the comparison between two means, discussed in some detail in the chapter on t-tests (chapter Comparing two means). If you can remember back that far, you will recall that there are several versions of the t-test. I will talk a little about Bayesian versions of the independent samples t-tests and the paired samples t-test in this section.
Independent samples t-test
The most common type of t-test is the independent samples t-test, and it
arises when you have data as in the harpo data set that we used in the
earlier chapter on t-tests (chapter Comparing two means). In this data
set, we have two groups of students, those who received lessons from Anastasia
and those who took their classes with Bernadette. The question we want to
answer is whether there is any difference in the grades received by these two
groups of students. Back in that chapter, I suggested you could analyse this
kind of data using the Independent Samples t-test in jamovi, which gave us
the results in Fig. 217. As we obtain a p-value less than 0.05,
we reject the null hypothesis.
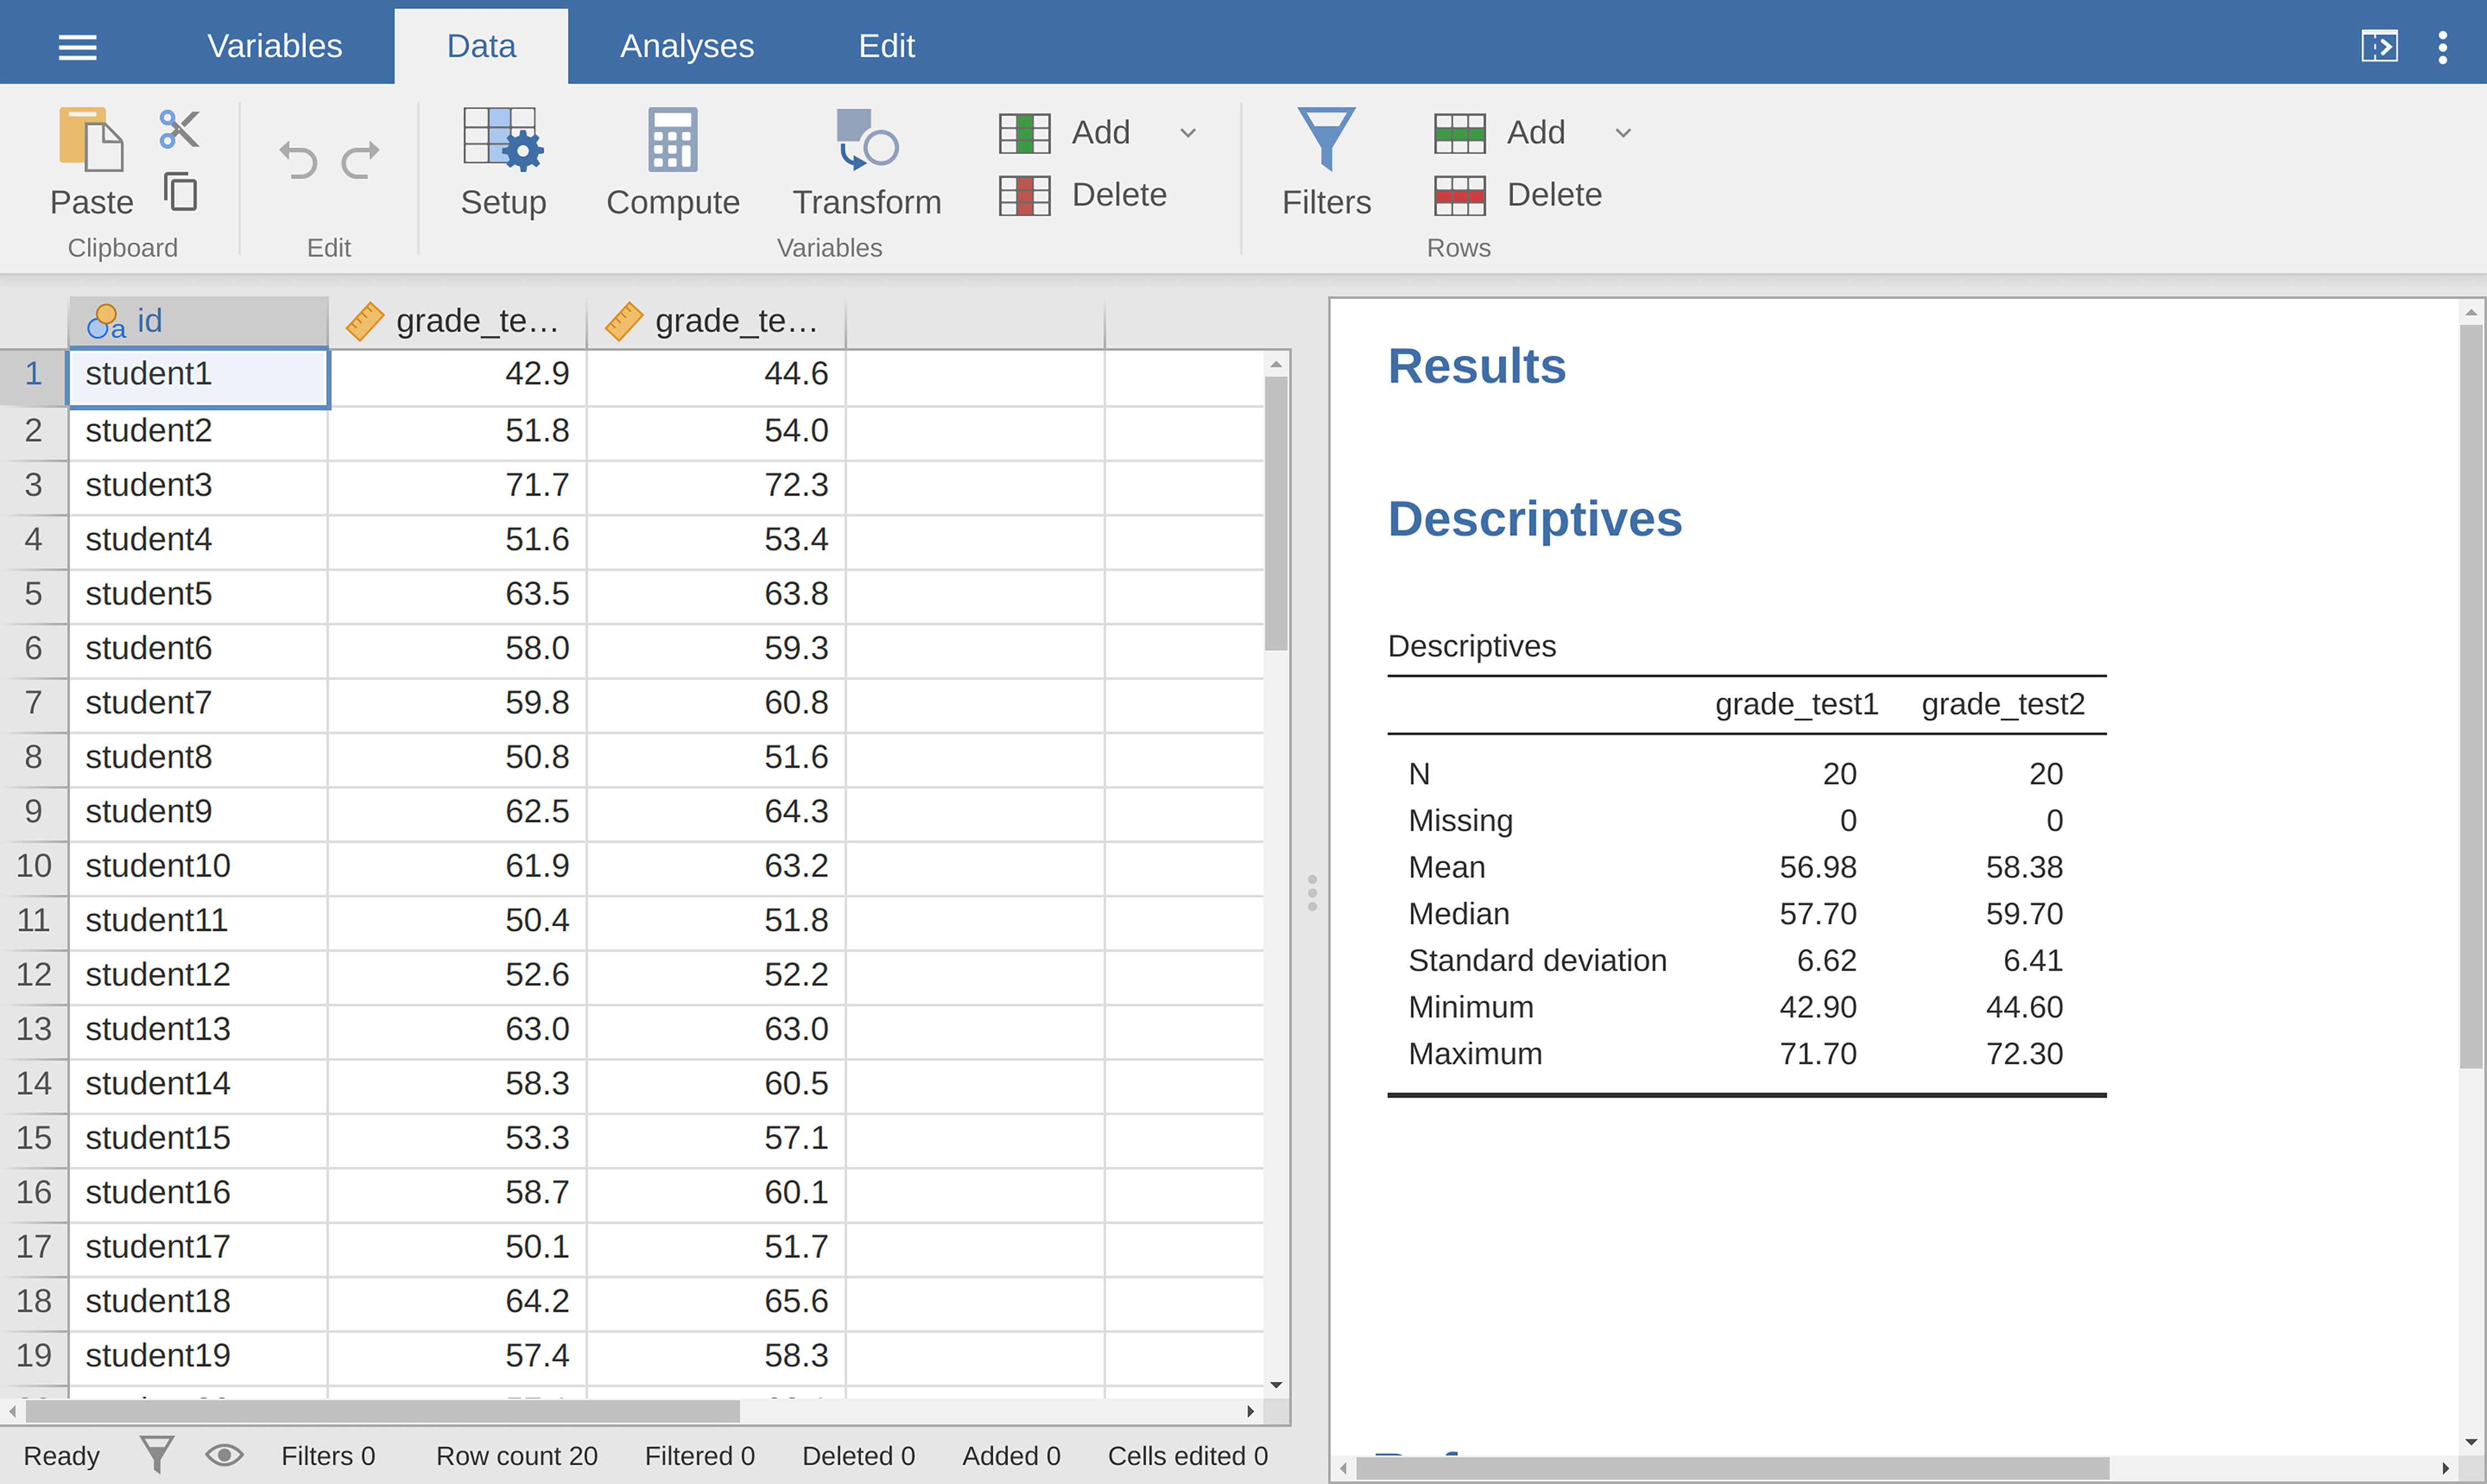
Fig. 217 Independent Samples T-Test result in jamovi
What does the Bayesian version of the t-test look like? We can get the Bayes
factor by selecting the Bayes Factor checkbox under the Tests option,
and accepting the suggested default value for the Prior. This gives the
results shown in the table in Fig. 218. What we get in this table is a
Bayes factor statistic of 1.75, meaning that the evidence provided by these
data are about 1.8:1 in favour of the alternative hypothesis.
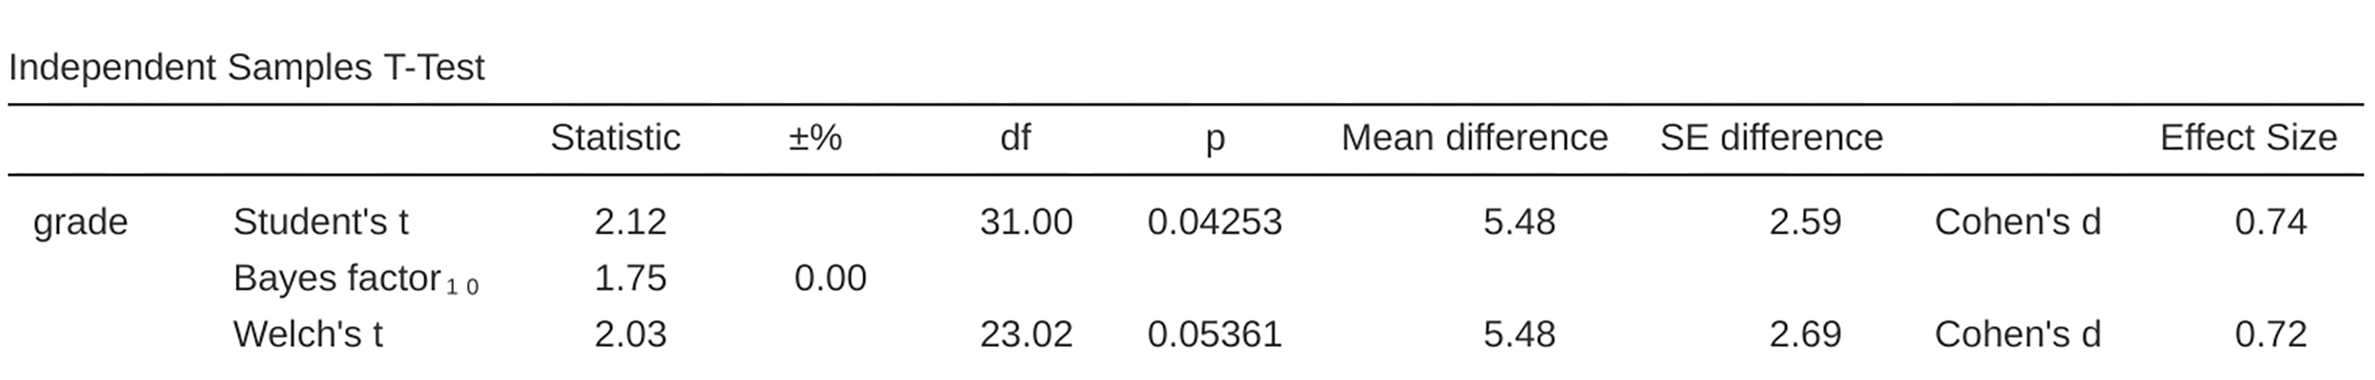
Fig. 218 Bayes Factor analysis alongside Independent Samples T-Test
Before moving on, it is worth highlighting the difference between the orthodox test results and the Bayesian one. According to the orthodox test, we obtained a significant result, though only barely. Nevertheless, many people would happily accept p = 0.043 as reasonably strong evidence for an effect. In contrast, notice that the Bayesian test does not even reach 2:1 odds in favour of an effect, and would be considered very weak evidence at best. In my experience that is a pretty typical outcome. Bayesian methods usually require more evidence before rejecting the null hypothesis.
Paired samples t-test
Back in section The paired-samples t-test I discussed the chico data set
in which student grades were measured on two tests, and we were interested in
finding out whether grades went up from test 1 to test 2. Because every student
did both tests, the tool we used to analyse the data was a paired samples
t-test. Fig. 219 shows the jamovi results table for the conventional
Paired Samples T-Test alongside the Bayes Factor analysis. At this
point, I hope you can read this output without any difficulty. The data provide
evidence of about 6000:1 in favour of the alternative. We could probably reject
the null hypothesis with some confidence!
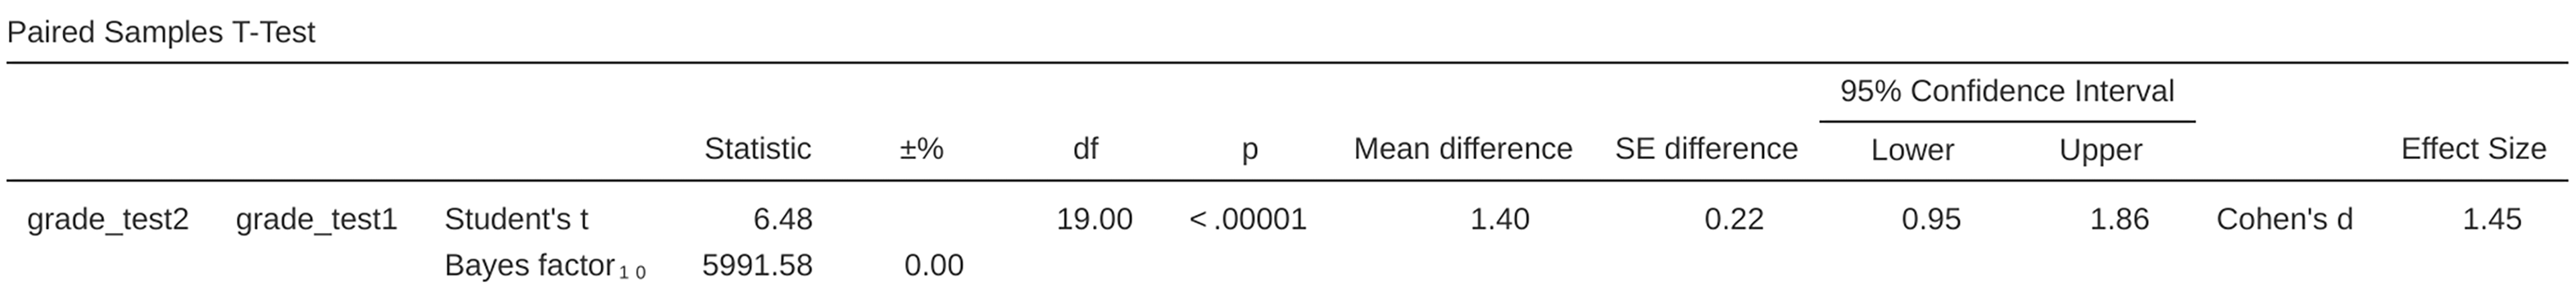
Fig. 219 Paired Samples T-Test and Bayes Factor result in jamovi