Autor des Abschnitts: Danielle J. Navarro and David R. Foxcroft
Reliabilitätsanalyse
Nachdem wir den Prozess der anfänglichen Entwicklung von Skalen (bzw. Fragebögen) mithilfe von EFA und CFA durchlaufen haben, sollten Sie ein Stadium erreicht haben, in dem die Skala unter Verwendung der CFA bei verschiedenen Studienpopulationen recht gut funktioniert. Eine weitere Sache, die Sie in diesem Stadium außerdem interessiert, ist zu sehen, wie gut sich die beobachteten Variablen, die mit einer Skala gemessen werden, zu Faktoren kombinieren lassen.
Innerhalb der Psychometrie verwendet man die Reliabilitätsanalyse, um Informationen darüber zu erhalten, wie konsistent eine Skala ein psychologisches Konstrukt misst (siehe Abschnitt Beurteilung der Zuverlässigkeit einer Messung). Wir befassen uns hier mit der inneren Konsistenz. Diese bezieht sich auf die Konsistenz aller einzelnen Items, aus denen eine Skala (oder ein gesamter Fragebogen) besteht. Wenn wir also V1, V2, V3, V4 und V5 als beobachtete Itemvariablen haben, dann können wir eine Statistik berechnen, die uns sagt, wie intern konsistent diese Items bei der Messung des zugrunde liegenden Konstrukts sind.
A popular statistic used to check the internal consistency of a scale is Cronbach’s α (alpha; Cronbach, 1951). Cronbach’s α is a measure of equivalence (whether different sets of scale items would give the same measurement outcomes). Equivalence is tested by dividing the scale items into two groups (a “split-half”) and seeing whether analysis of the two parts gives comparable results. Of course, there are many ways a set of items could be split, but if all possible splits are made then it is possible to produce a statistic that reflects the overall pattern of split-half coefficients. Cronbach’s α is such a statistic: a function of all the split-half coefficients for a scale. If a set of items that measure a construct (e.g., an Extraversion scale) has an α of 0.80, then the proportion of error variance in the scale is 0.20. In other words, a scale with an α of 0.80 includes approximately 20% error.
BUT, and that is a big “BUT”, Cronbach’s α is not a measure of unidimensionality (i.e., an indicator that a scale is measuring a single factor or construct rather than multiple related constructs). Scales that are multidimensional will cause α to be under-estimated if not assessed separately for each dimension, but high values for α are not necessarily indicators of unidimensionality. So, an α of 0.80 does not mean that 80% of a single underlying construct is accounted for. It could be that the 80% comes from more than one underlying construct. That is why EFA and CFA are useful to do first.
Further, another feature of α is that it tends to be sample specific: it is not a characteristic of the scale, but rather a characteristic of the sample in which the scale has been used. A biased, unrepresentative, or small sample could produce a very different α coefficient than a large, representative sample. α can even vary from large sample to large sample. Nevertheless, despite these limitations, Cronbach’s α has been popular in Psychology for estimating internal consistency reliability. It is pretty easy to calculate, understand and interpret, and therefore it can be a useful initial check on scale performance when you administer a scale with a different sample, from a different setting or population, for example.
Eine Alternative ist McDonald’s ω (Omega), und jamovi liefert auch diese Statistik. Während für α die folgenden Annahmen gelten: (a) keine Restkorrelationen, (b) identische Ladungen der Items und (c) die Skala ist eindimensional, ist dies bei ω nicht der Fall, so dass es sich um eine robustere Zuverlässigkeitsstatistik handelt. Wenn diese Annahmen nicht verletzt werden, dann sind α und ω ähnlich, aber wenn sie es sind, dann ist ω vorzuziehen.
Manchmal wird ein Schwellenwert für α oder ω angegeben, der einen „ausreichend guten“ Wert suggeriert. Dies könnte z. B. α von 0,70 oder 0,80 sein, was eine „akzeptable“ bzw. „gute“ Reliabilität bedeutet. Dies hängt jedoch davon ab, was genau mit der Skala gemessen werden soll. Daher sollten solche Schwellenwerte mit Bedacht verwendet werden. Es wäre besser, einfach zu sagen, dass ein α oder ω von 0,70 mit einer Fehlervarianz von 30 % in einer Skala verbunden ist, und ein α oder ω von 0,80 mit einer Fehlervarianz von 20 %.
Kann α zu hoch sein? Wenn der Koeffizient α über 0,95 liegt, deutet dies auf hohe Interkorrelationen zwischen den Items hin. Dies weiterum kann bedeuten, dass die Items möglicherweise zu redundant sind und das Risiko besteht, dass das gemessene Konstrukt zu eng ist.
Reliabilitätsanalyse in jamovi
Wir haben eine dritte Stichprobe mit Daten eines Persönlichkeitsfragebogens, den Datensatz bfi_sample3. Diesen können wir für die Reliabilitätsanalyse verwenden. Überprüfen Sie noch einmal, dass die 25 Persönlichkeitsvariablen als kontinuierlich  kodiert sind. Die Schritte um eine Reliabilitätsanalyse in jamovi durchzuführen sind:
Select
Factor→Reliability Analysisfrom theAnalysestab in jamovi to open the options panel where you can determine the settings for the reliability analysis (Abb. 214).Select the five
A-variables and transfer them into theItemsbox.Wählen Sie unter der Option
Reverse Scaled Itemsdie VariableA1im FeldNormal Scaled Itemsund verschieben Sie diese in das FeldReverse Scaled Items.Check other appropriate options, as in Abb. 214.
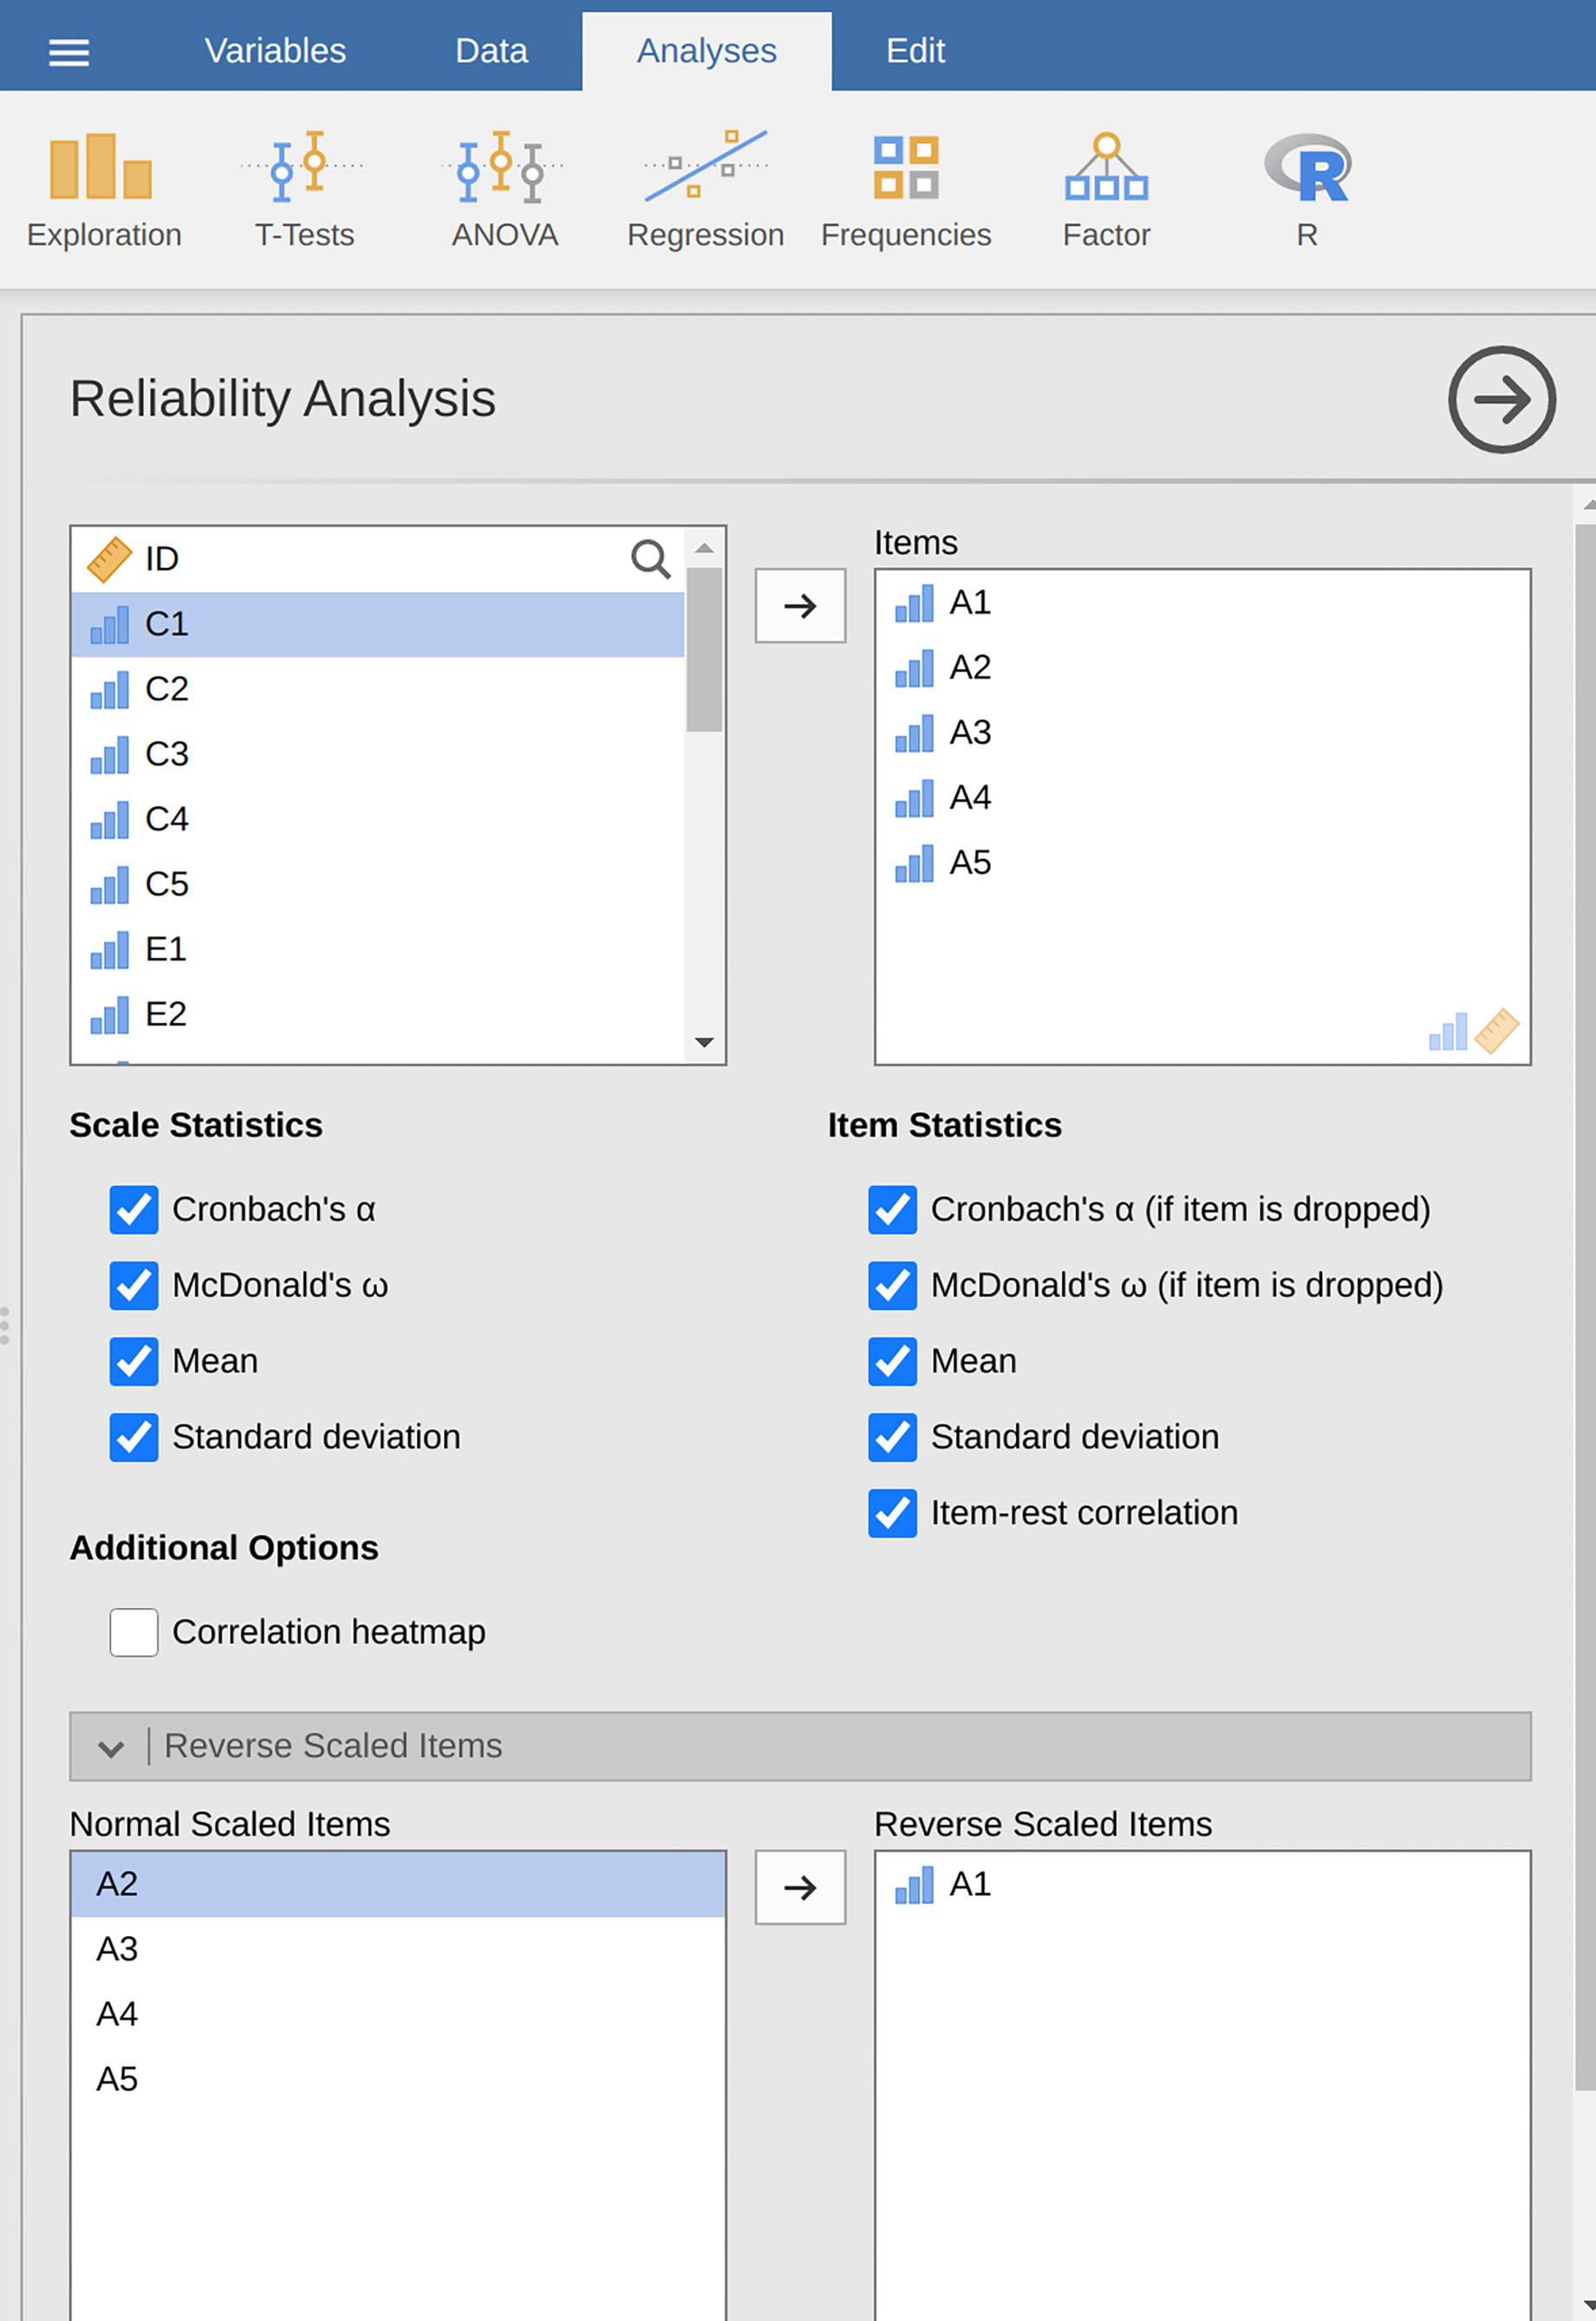
Abb. 214 Optionspanel mit den Einstellungen zum Durchführen einer Reliabilitätsanalyse in jamovi
Once done, look across at the jamovi results window. You should see something like Abb. 215. This tells us that the Cronbach’s α coefficient for the Agreeableness scale is 0.72. This means that just under 30% of the Agreeableness scale score is error variance. McDonald’s ω is also given, and this is 0.74, not much different from α.
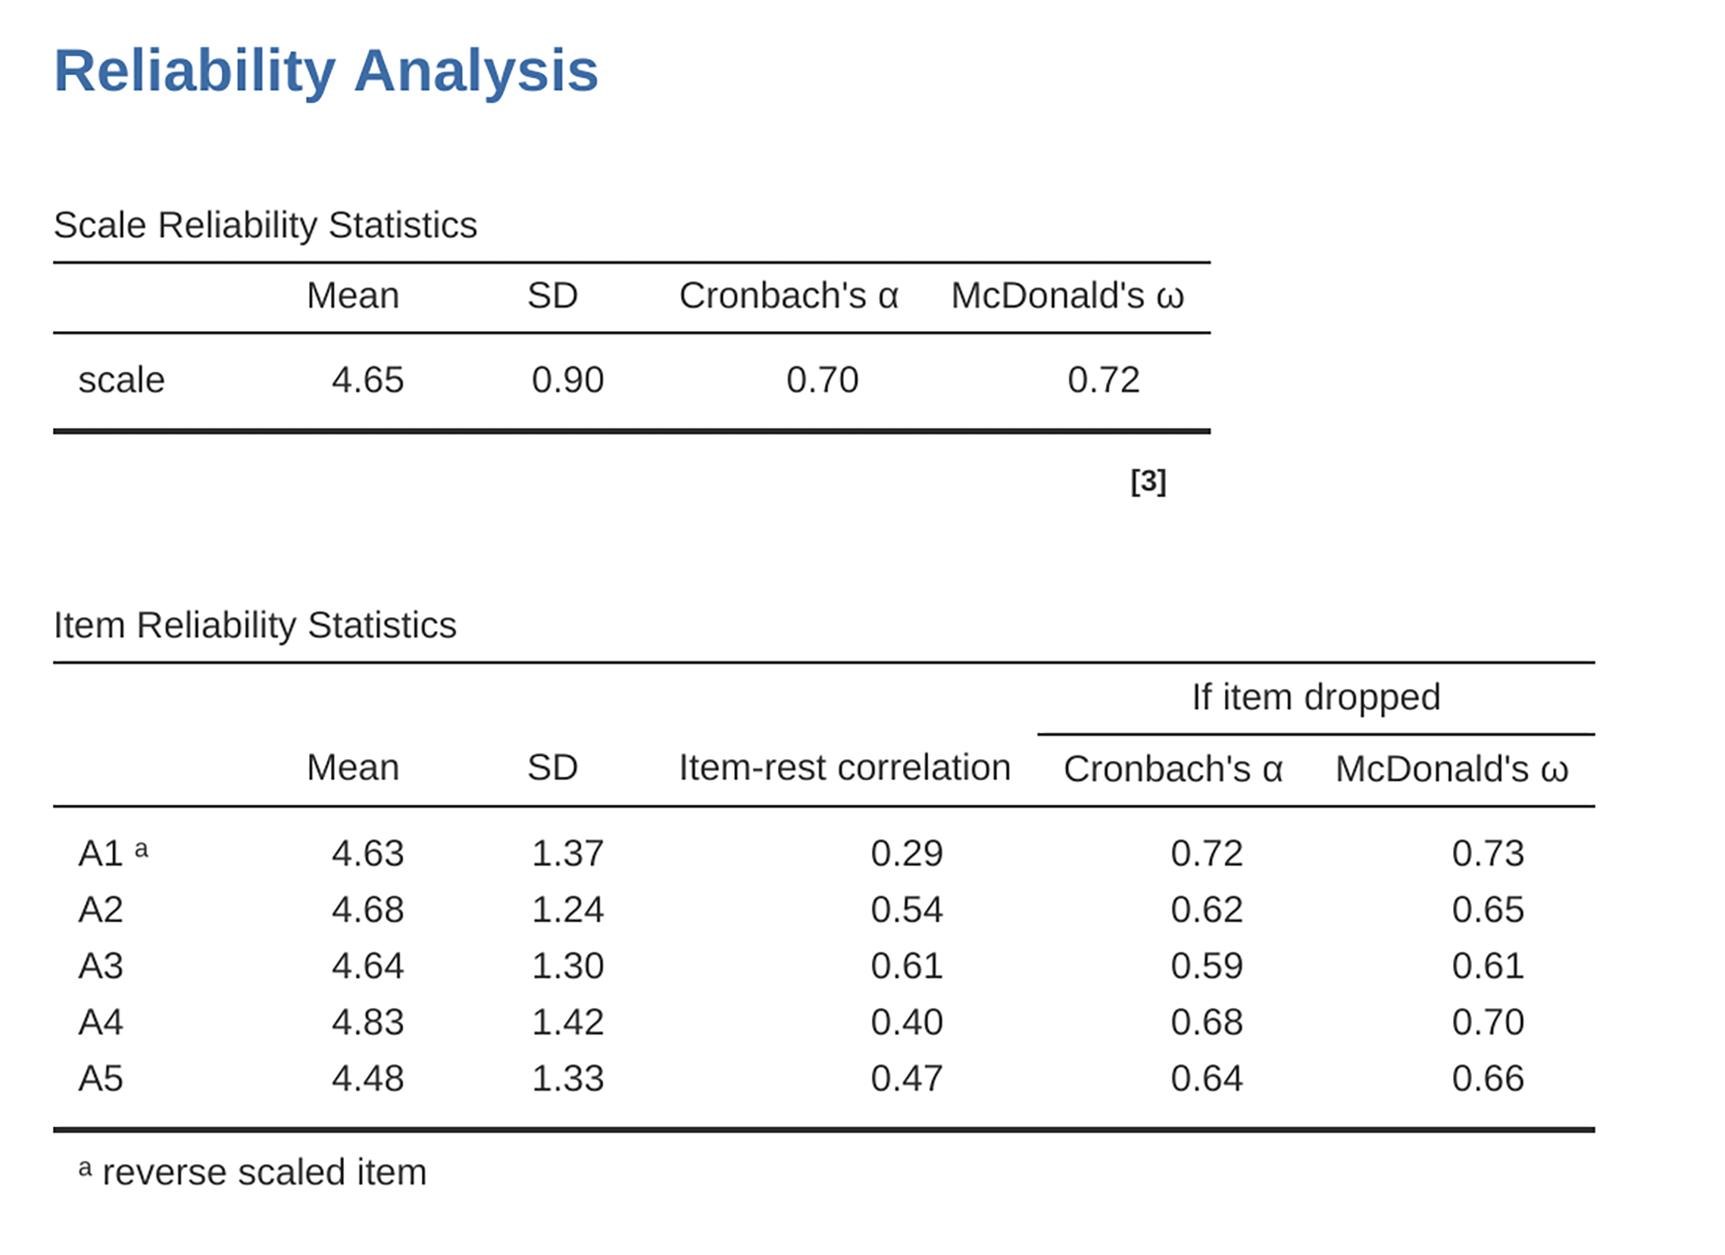
Abb. 215 Tabellen mit den Ergebnissen der Reliabilitätsanalyse für den Faktor Verträglichkeit (agreeableness) aus dem Datensatz bfi_sample3
We can also check how α or ω can be improved if a specific item is dropped from the scale. For example, α would increase to 0.72 and ω to 0.74 if we dropped item A1. This is not a big increase, so probably not worth doing.
Das Verfahren zur Berechnung und Überprüfung der Relibilitätsstatistiken (α und ω) ist für alle anderen Skalen gleich, und alle hatten ähnliche Reliabilitätsschätzungen mit Ausnahme von Offenheit für Erfahrungen (α = 0,60, ω = 0,62). Bei Offenheit beträgt die Fehlervarianz etwa 40 %, was hoch ist und darauf hindeutet, dass Offenheit als zuverlässiges Maß für ein Persönlichkeitsmerkmal wesentlich weniger konsistent ist als die Maße der übrigen Persönlichkeitsdimensionen.