Forfatter av avsnitt: Danielle J. Navarro and David R. Foxcroft
Prøver, populasjoner og prøvetaking
In the prelude to part IV, I discussed the riddle of induction and highlighted the fact that all learning requires you to make assumptions. Accepting that this is true, our first task to come up with some fairly general assumptions about data that make sense. This is where sampling theory comes in. If probability theory is the foundations upon which all statistical theory builds, sampling theory is the frame around which you can build the rest of the house. Sampling theory plays a huge role in specifying the assumptions upon which your statistical inferences rely. And in order to talk about “making inferences” the way statisticians think about it we need to be a bit more explicit about what it is that we are drawing inferences from (the sample) and what it is that we are drawing inferences about (the population).
In almost every situation of interest what we have available to us as researchers is a sample of data. We might have run an experiment with some number of participants, a polling company might have phoned some number of people to ask questions about voting intentions, and so on. In this way the data set available to us is finite and incomplete. We can not possibly get every person in the world to do our experiment, for example a polling company does not have the time or the money to ring up every voter in the country. In our earlier discussion of Deskriptivstatistikk, this sample was the only thing we were interested in. Our only goal was to find ways of describing, summarising and graphing that sample. This is about to change.
Definere en populasjon
A sample is a concrete thing. You can open up a data file and there is the data from your sample. A population, on the other hand, is a more abstract idea. It refers to the set of all possible people, or all possible observations, that you want to draw conclusions about and is generally much bigger than the sample. In an ideal world the researcher would begin the study with a clear idea of what the population of interest is, since the process of designing a study and testing hypotheses with the data does depend on the population about which you want to make statements.
Sometimes it is easy to state the population of interest. For instance, in the “polling company” example that opened the chapter the population consisted of all voters enrolled at the time of the study, millions of people. The sample was a set of 1000 people who all belong to that population. In most studies the situation is much less straightforward. In a typical psychological experiment determining the population of interest is a bit more complicated. Suppose I run an experiment using 100 undergraduate students as my participants. My goal, as a cognitive scientist, is to try to learn something about how the mind works. So, which of the following would count as “the population”:
Alle psykologistudentene ved University of Adelaide?
Psykologistudenter generelt, hvor som helst i verden?
Australiere som lever i dag?
Australiere i samme alder som mitt utvalg?
Er det noen som er i live nå?
Ethvert menneske, i fortid, nåtid eller fremtid?
Ethvert intelligent vesen?
Each of these defines a real group of mind-possessing entities, all of which might be of interest to me as a cognitive scientist, and it is not at all clear which one ought to be the true population of interest. As another example, consider the Wellesley-Croker game that we discussed in the prelude. The sample here is a specific sequence of 12 wins and 0 losses for Wellesley. What is the population?
Alle utfallene frem til Wellesley og Croker ankom bestemmelsesstedet?
Hva hadde skjedd om Wellesley og Croker hadde spilt spillet resten av livet?
Hva ville skjedd hvis Wellseley og Croker levde evig og spilte spillet til verden gikk tom for åser?
All outcomes if we created an infinite set of parallel universes and the Wellesely / Croker pair made guesses about the same 12 hills in each universe?
Again, it is not obvious what the population is.
Enkle tilfeldige utvalg
Uansett hvordan jeg definerer populasjonen, er det avgjørende poenget at utvalget er en delmengde av populasjonen, og målet vårt er å bruke kunnskapen om utvalget til å trekke slutninger om egenskapene til populasjonen. Forholdet mellom de to avhenger av prosedyren utvalget ble trukket etter. Denne prosedyren kalles en utvalgsmetode, og det er viktig å forstå hvorfor den er viktig.
To keep things simple, let us imagine that we have a bag containing 10 chips. Each chip has a unique letter printed on it so we can distinguish between the 10 chips. The chips come in two colours, black and white. This set of chips is the population of interest and it is depicted graphically on the left of Fig. 69. As you can see from looking at the picture there are four black chips and six white chips, but of course in real life we would not know that unless we looked in the bag. Now imagine you run the following “experiment”: you shake up the bag, close your eyes, and pull out four chips without putting any of them back into the bag. First out comes the a chip (black), then the c chip (white), then j (white) and then finally b (black). If you wanted you could then put all the chips back in the bag and repeat the experiment, as depicted on the right-hand side of Fig. 69. Each time you get different results but the procedure is identical in each case. The fact that the same procedure can lead to different results each time is what we refer to as a random process.[1] However, because we shook the bag before pulling any chips out, it seems reasonable to think that every chip has the same chance of being selected. A procedure in which every member of the population has the same chance of being selected is called a simple random sample. The fact that we did not put the chips back in the bag after pulling them out means that you can not observe the same thing twice, and in such cases the observations are said to have been sampled without replacement.
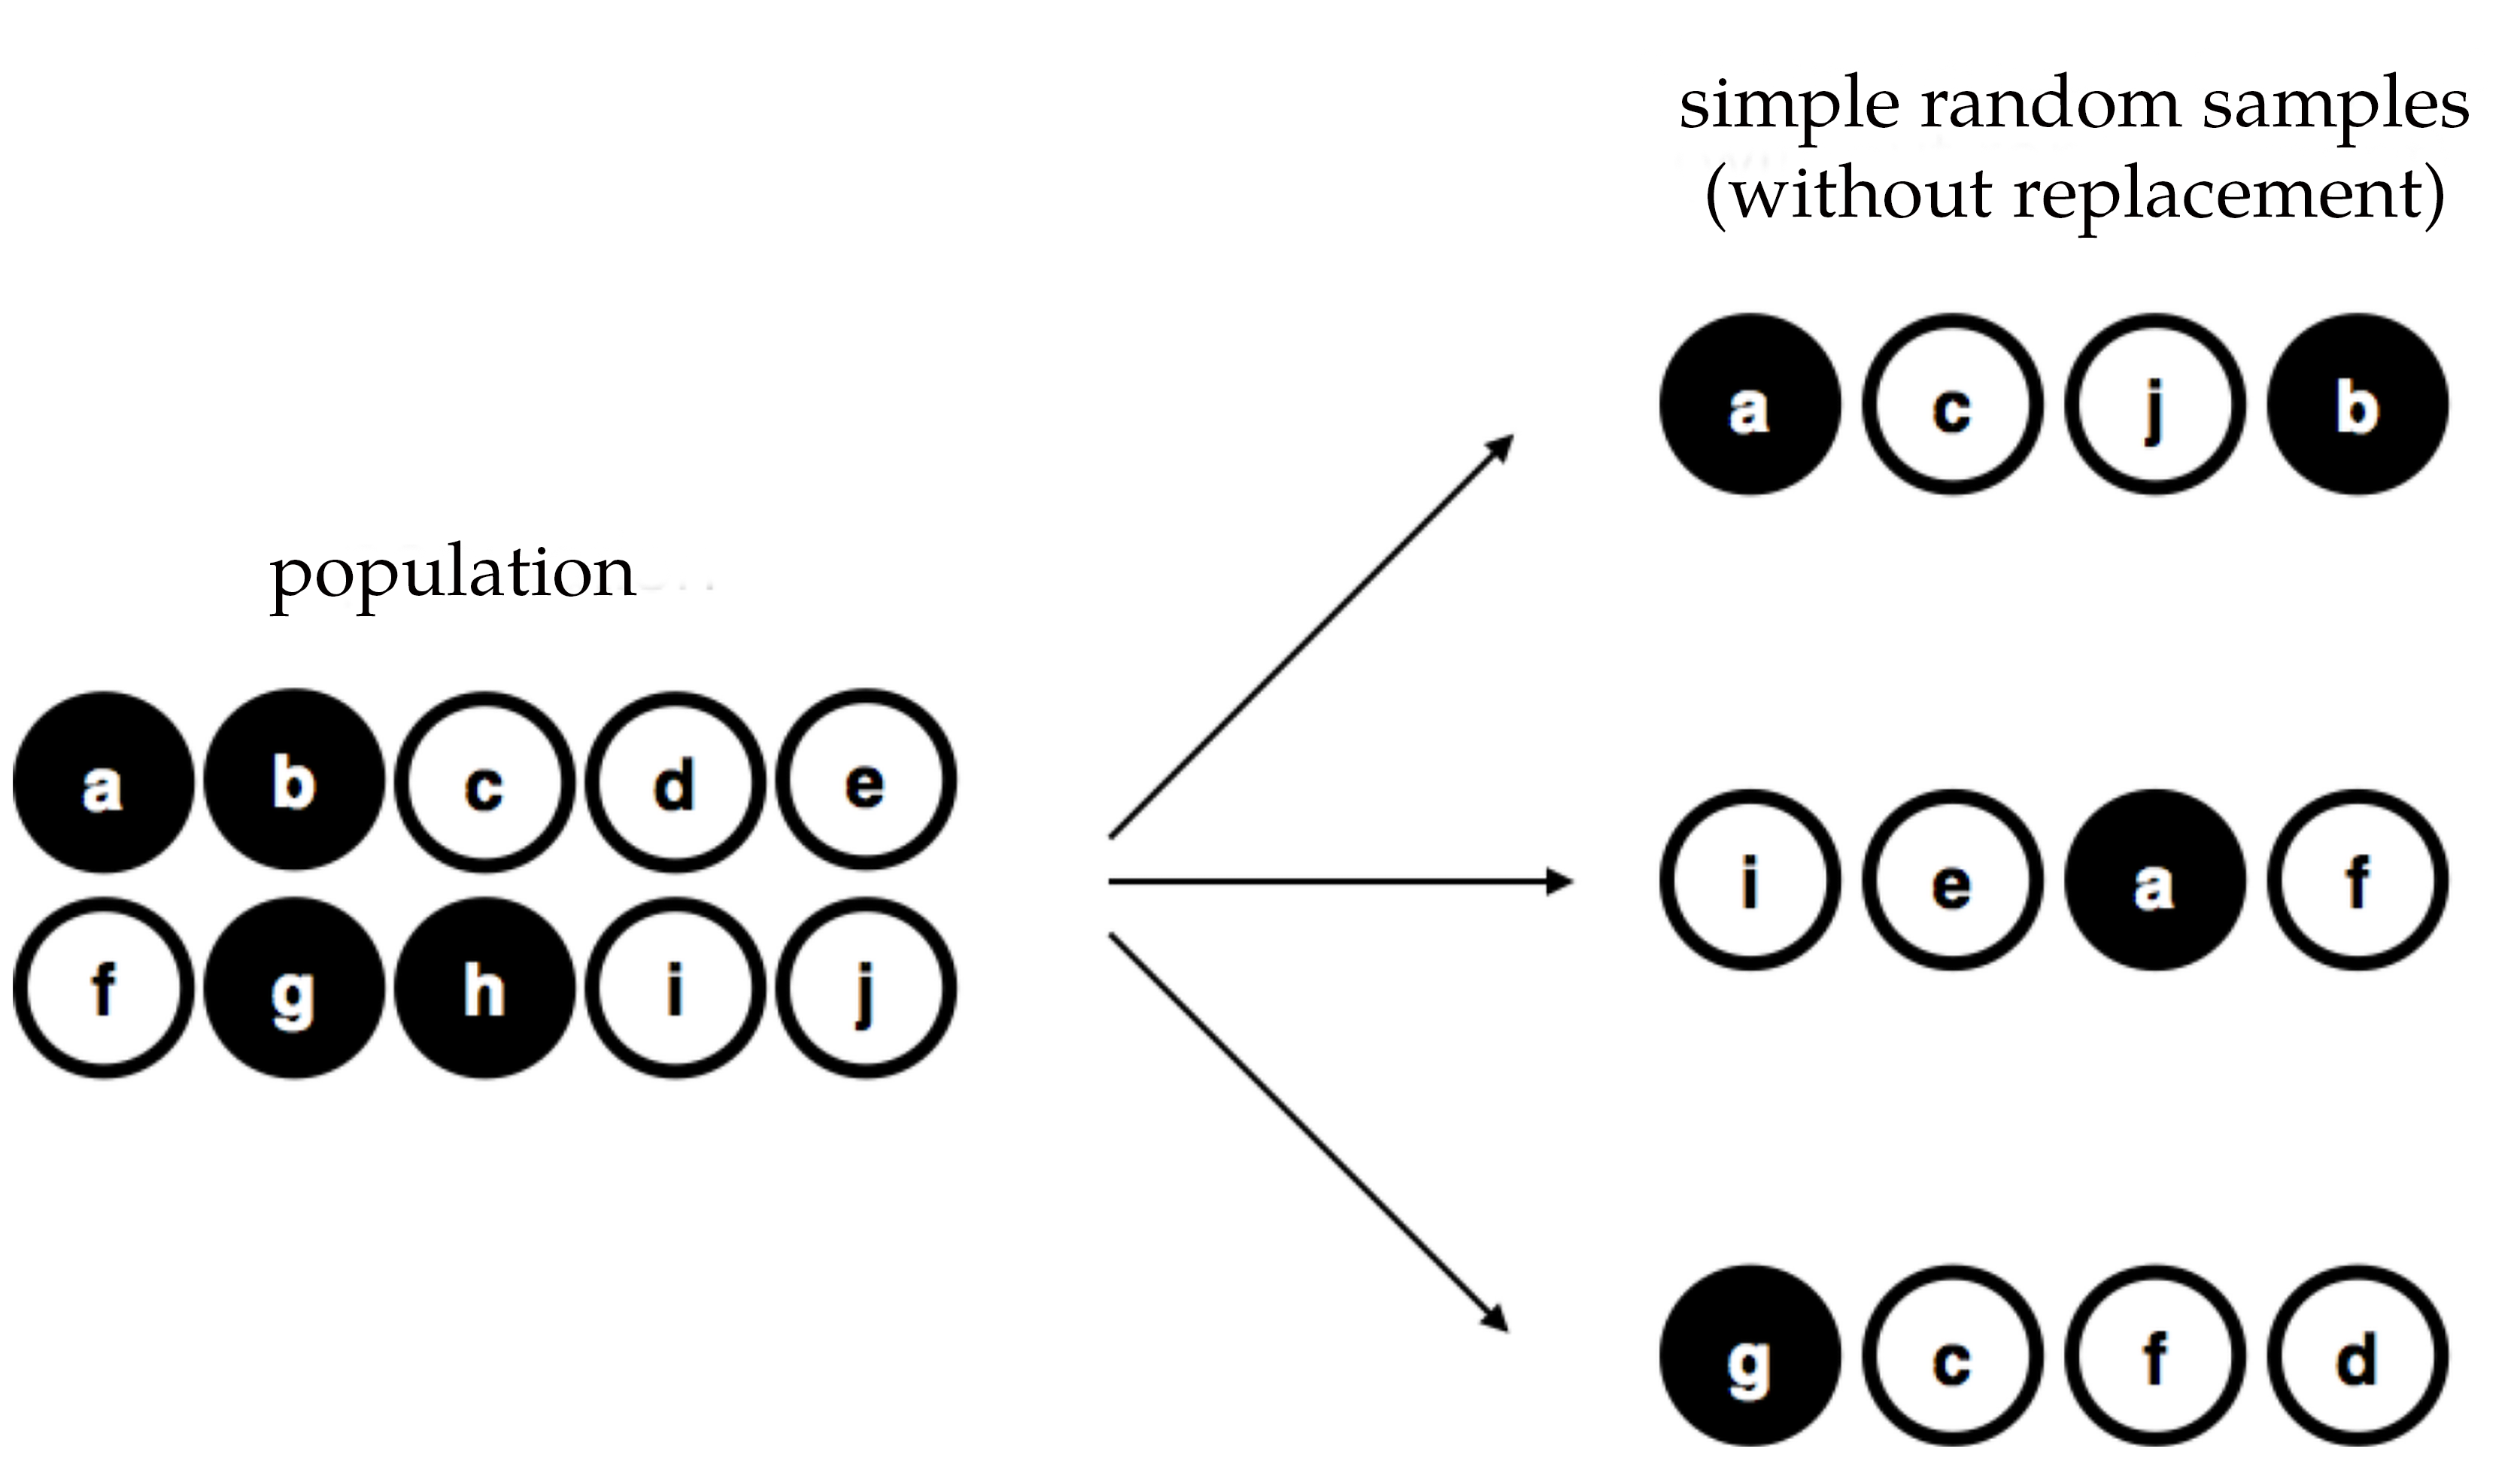
Fig. 69 Enkelt tilfeldig utvalg UTEN erstatning fra en begrenset populasjon
To help make sure you understand the importance of the sampling procedure, consider an alternative way in which the experiment could have been run. Suppose that my 5-year old son had opened the bag and decided to pull out four black chips without putting any of them back in the bag. This biased sampling scheme is depicted in Fig. 70. Now consider the evidential value of seeing four black chips and zero white chips. Clearly it depends on the sampling scheme, does it not? If you know that the sampling scheme is biased to select only black chips then a sample that consists of only black chips does not tell you very much about the population! For this reason statisticians really like it when a data set can be considered a simple random sample, because it makes the data analysis much easier.
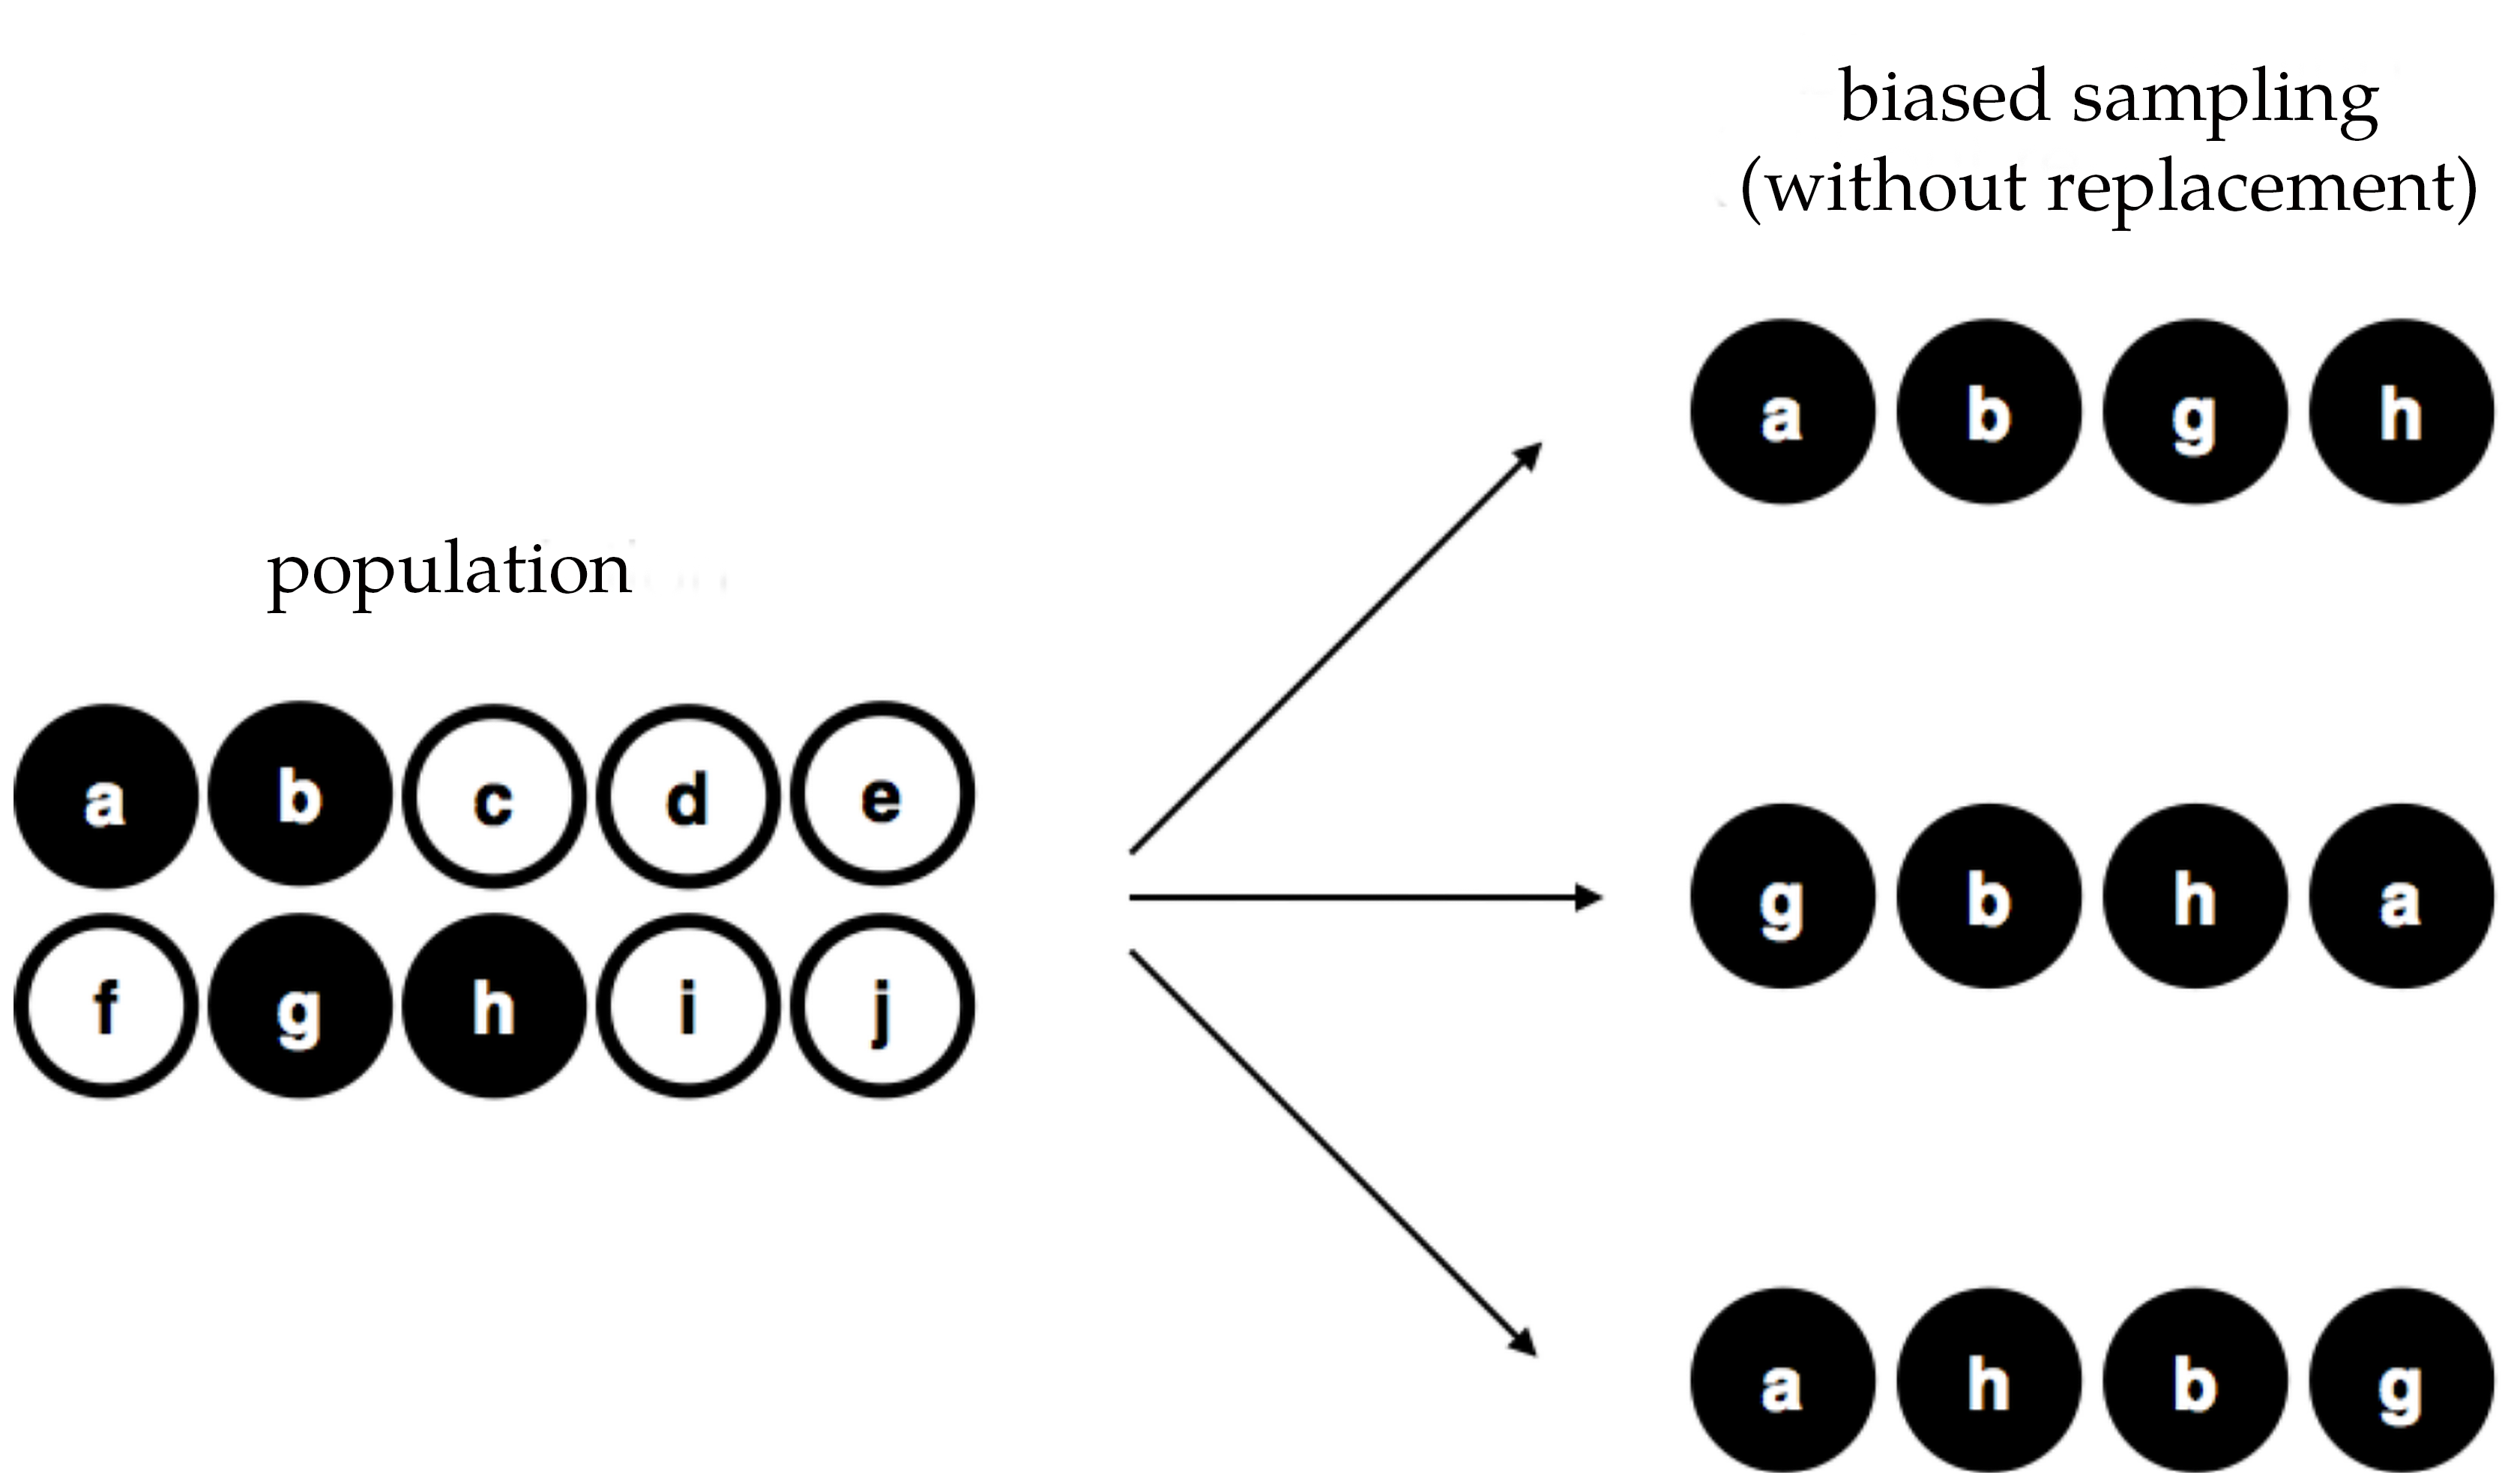
Fig. 70 Skjevhet (bias) i utvalget UTEN erstatning fra en begrenset populasjon
A third procedure is worth mentioning. This time around we close our eyes, shake the bag, and pull out a chip. This time, however, we record the observation and then put the chip back in the bag. Again we close our eyes, shake the bag, and pull out a chip. We then repeat this procedure until we have four chips. Data sets generated in this way are still simple random samples, but because we put the chips back in the bag immediately after drawing them it is referred to as a sample with replacement. The difference between this situation and the first one is that it is possible to observe the same population member multiple times, as illustrated in numref:fig8-3.
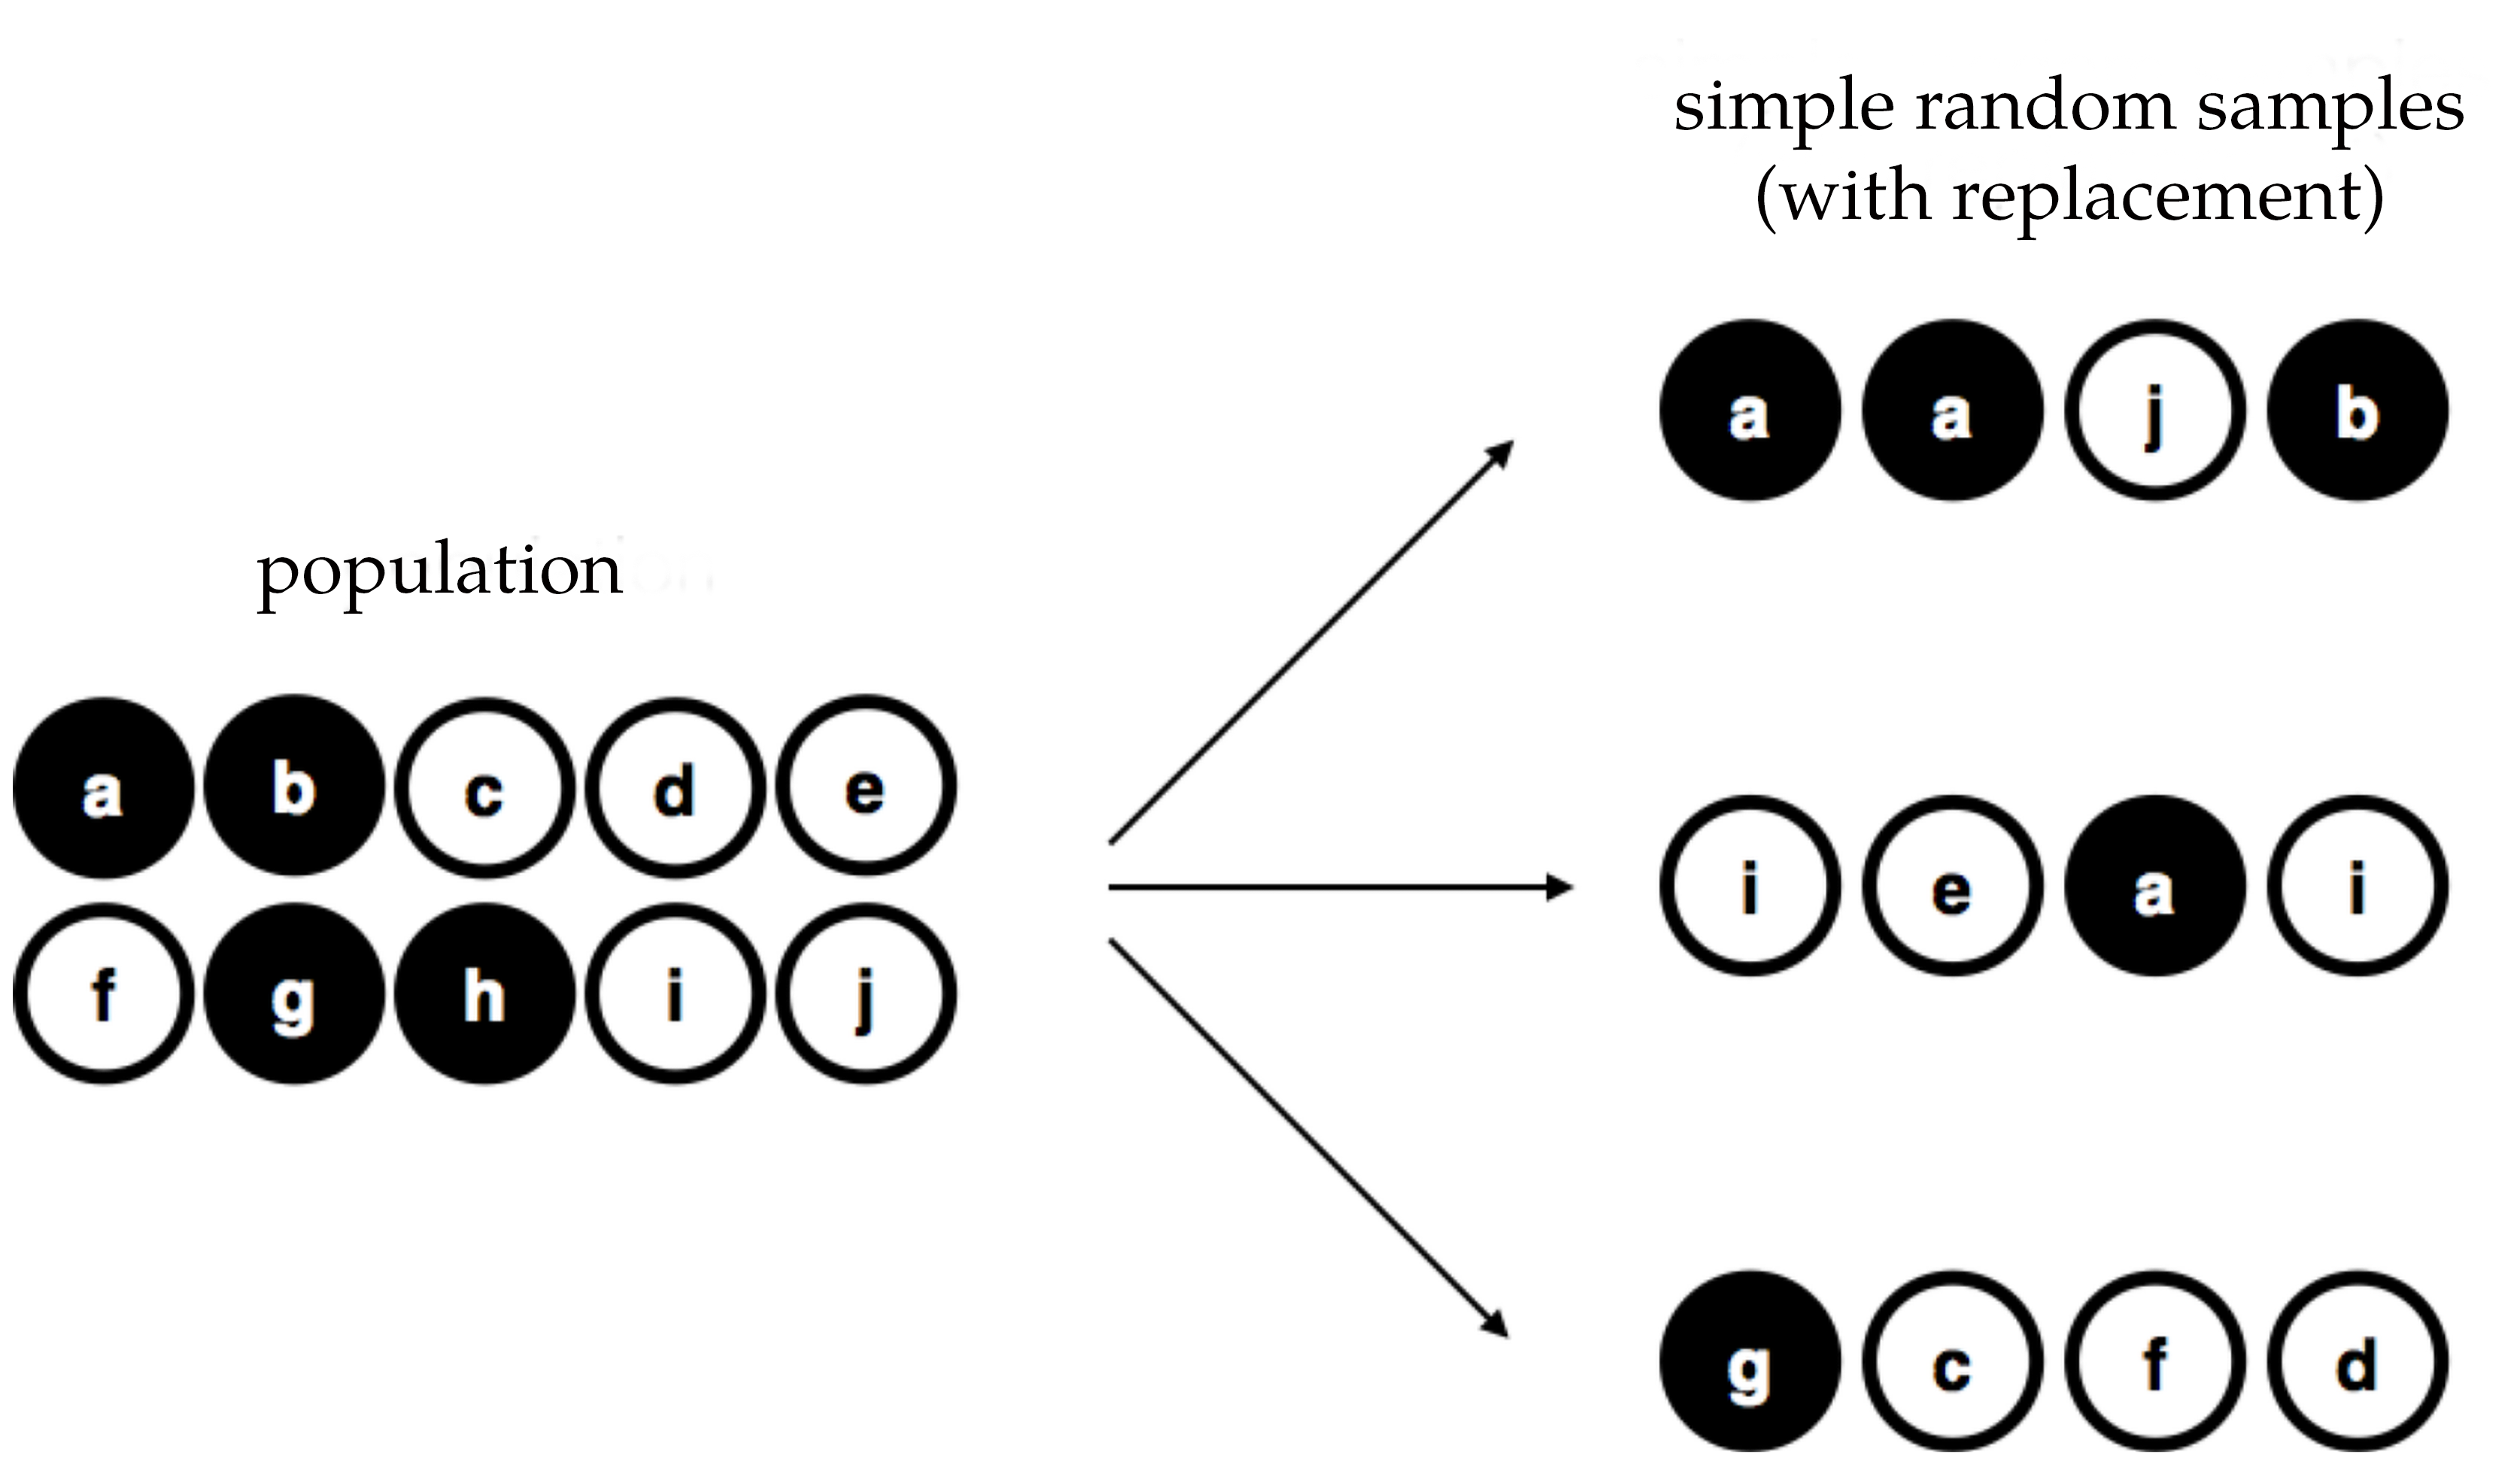
Fig. 71 Enkelt tilfeldig utvalg MED erstatning fra en begrenset populasjon
In my experience, most psychology experiments tend to be sampling without replacement, because the same person is not allowed to participate in the experiment twice. However, most statistical theory is based on the assumption that the data arise from a simple random sample with replacement. In real life this very rarely matters. If the population of interest is large (e.g., has more than 10 entities!) the difference between sampling with and without replacement is too small to be concerned with. The difference between simple random samples and biased samples, on the other hand, is not such an easy thing to dismiss.
De fleste utvalg er ikke enkle tilfeldige utvalg
As you can see from looking at the list of possible populations that I showed above, it is almost impossible to obtain a simple random sample from most populations of interest. When I run experiments I would consider it a minor miracle if my participants turned out to be a random sampling of the undergraduate psychology students at Adelaide university, even though this is by far the narrowest population that I might want to generalise to. A thorough discussion of other types of sampling schemes is beyond the scope of this book, but to give you a sense of what is out there I will list a few of the more important ones.
Stratified sampling. Suppose your population is (or can be) divided into several different sub-populations, or strata. Perhaps you are running a study at several different sites, for example. Instead of trying to sample randomly from the population as a whole, you instead try to collect a separate random sample from each of the strata. Stratified sampling is sometimes easier to do than simple random sampling, especially when the population is already divided into the distinct strata. It can also be more efficient than simple random sampling, especially when some of the sub-populations are rare. For instance, when studying schizophrenia it would be much better to divide the population into two[2] strata (schizophrenic and not-schizophrenic) and then sample an equal number of people from each group. If you selected people randomly you would get so few schizophrenic people in the sample that your study would be useless. This specific kind of of stratified sampling is referred to as oversampling because it makes a deliberate attempt to over-represent rare groups.
Snowball sampling is a technique that is especially useful when sampling from a “hidden” or hard to access population and is especially common in social sciences. For instance, suppose the researchers want to conduct an opinion poll among transgender people. The research team might only have contact details for a few transgender people, so the survey starts by asking them to participate (stage 1). At the end of the survey the participants are asked to provide contact details for other people who might want to participate. In stage 2 those new contacts are surveyed. The process continues until the researchers have sufficient data. The big advantage to snowball sampling is that it gets you data in situations that might otherwise be impossible to get any. On the statistical side, the main disadvantage is that the sample is highly non-random, and non-random in ways that are difficult to address. On the real-life side, the disadvantage is that the procedure can be unethical if not handled well, because hidden populations are often hidden for a reason. I chose transgender people as an example here to highlight this issue. If you were not careful you might end up outing people who do not want to be outed (very, very bad form), and even if you do not make that mistake it can still be intrusive to use people’s social networks to study them. It is certainly very hard to get people’s informed consent before contacting them, yet in many cases the simple act of contacting and invite them to be studied can be hurtful. Social networks are complex things, and just because you can use them to get data does not always mean you should.
Bekvemmelighetsutvalg er mer eller mindre det det høres ut som. Utvalgene velges ut på en måte som er praktisk for forskeren, og velges ikke tilfeldig fra den populasjonen man er interessert i. Snøballutvalg er én type bekvemmelighetsutvalg, men det finnes mange andre. Et vanlig eksempel innen psykologi er studier som baserer seg på psykologistudenter på lavere grad. Disse utvalgene er generelt ikke tilfeldige på to måter. For det første betyr det å basere seg på psykologistudenter automatisk at dataene dine er begrenset til en enkelt delpopulasjon. For det andre får studentene vanligvis velge hvilke studier de vil delta i, slik at utvalget er en selvvalgt delmengde av psykologistudenter og ikke en tilfeldig utvalgt delmengde. I det virkelige liv er de fleste studier bekvemmelighetsutvalg av en eller annen form. Dette er noen ganger en alvorlig begrensning, men ikke alltid.
How much does it matter if you do not have a simple random sample?
Okay, so real-world data collection tends not to involve nice simple random samples. Does that matter? A little thought should make it clear to you that it can matter if your data are not a simple random sample. Just think about the difference between Fig. 69 and Fig. 70. However, it is not quite as bad as it sounds. Some types of biased samples are entirely unproblematic. For instance, when using a stratified sampling technique you actually know what the bias is because you created it deliberately, often to increase the effectiveness of your study, and there are statistical techniques that you can use to adjust for the biases you have introduced (not covered in this book!). So in those situations it is not a problem.
More generally though, it is important to remember that random sampling is a means to an end, and not the end in itself. Let us assume you have relied on a convenience sample, and as such you can assume it is biased. A bias in your sampling method is only a problem if it causes you to draw the wrong conclusions. When viewed from that perspective, I would argue that we do not need the sample to be randomly generated in every respect, we only need it to be random with respect to the psychologically-relevant phenomenon of interest. Suppose I am doing a study looking at working memory capacity. In study 1, I actually have the ability to sample randomly from all human beings currently alive, with one exception: I can only sample people born on a Monday. In study 2, I am able to sample randomly from the Australian population. I want to generalise my results to the population of all living humans. Which study is better? The answer, obviously, is study 1. Why? Because we have no reason to think that being “born on a Monday” has any interesting relationship to working memory capacity. In contrast, I can think of several reasons why “being Australian” might matter. Australia is a wealthy, industrialised country with a very well-developed education system. People growing up in that system will have had life experiences much more similar to the experiences of the people who designed the tests for working memory capacity. This shared experience might easily translate into similar beliefs about how to “take a test”, a shared assumption about how psychological experimentation works, and so on. These things might actually matter. For instance, “test taking” style might have taught the Australian participants how to direct their attention exclusively on fairly abstract test materials much more than people who have not grown up in a similar environment. This could therefore lead to a misleading picture of what working memory capacity is.
There are two points hidden in this discussion. First, when designing your own studies, it is important to think about what population you care about and try hard to sample in a way that is appropriate to that population. In practice, you are usually forced to put up with a “sample of convenience” (e.g., psychology lecturers sample psychology students because that is the least expensive way to collect data, and our coffers are not exactly overflowing with gold), but if so you should at least spend some time thinking about what the dangers of this practice might be. Second, if you are going to criticise someone else’s study because they have used a sample of convenience rather than laboriously sampling randomly from the entire human population, at least have the courtesy to offer a specific theory as to how this might have distorted the results.
Populasjonsparametere og utvalgsstatistikk
Setting aside the thorny methodological issues associated with obtaining a random sample, let us consider a slightly different issue. Up to this point we have been talking about populations the way a scientist might. To a psychologist a population might be a group of people. To an ecologist a population might be a group of bears. In most cases the populations that scientists care about are concrete things that actually exist in the real world. Statisticians, however, are a funny lot. On the one hand, they are interested in real-world data and real science in the same way that scientists are. On the other hand, they also operate in the realm of pure abstraction in the way that mathematicians do. As a consequence, statistical theory tends to be a bit abstract in how a population is defined. In much the same way that psychological researchers operationalise our abstract theoretical ideas in terms of concrete measurements (section Introduksjon til psykologisk måling), statisticians operationalise the concept of a “population” in terms of mathematical objects that they know how to work with. You have already come across these objects in chapter Introduksjon til sannsynlighetsregning. They are called probability distributions.
The idea is quite simple. Let us say we are talking about IQ scores. To a psychologist the population of interest is a group of actual humans who have IQ scores. A statistician “simplifies” this by operationally defining the population as the probability distribution depicted in the left panel of Fig. 72. IQ tests are designed so that the average IQ is 100, the standard deviation of IQ scores is 15, and the distribution of IQ scores is normal. These values are referred to as the population parameters because they are characteristics of the entire population. That is, we say that the population mean µ is 100 and the population standard deviation σ is 15.
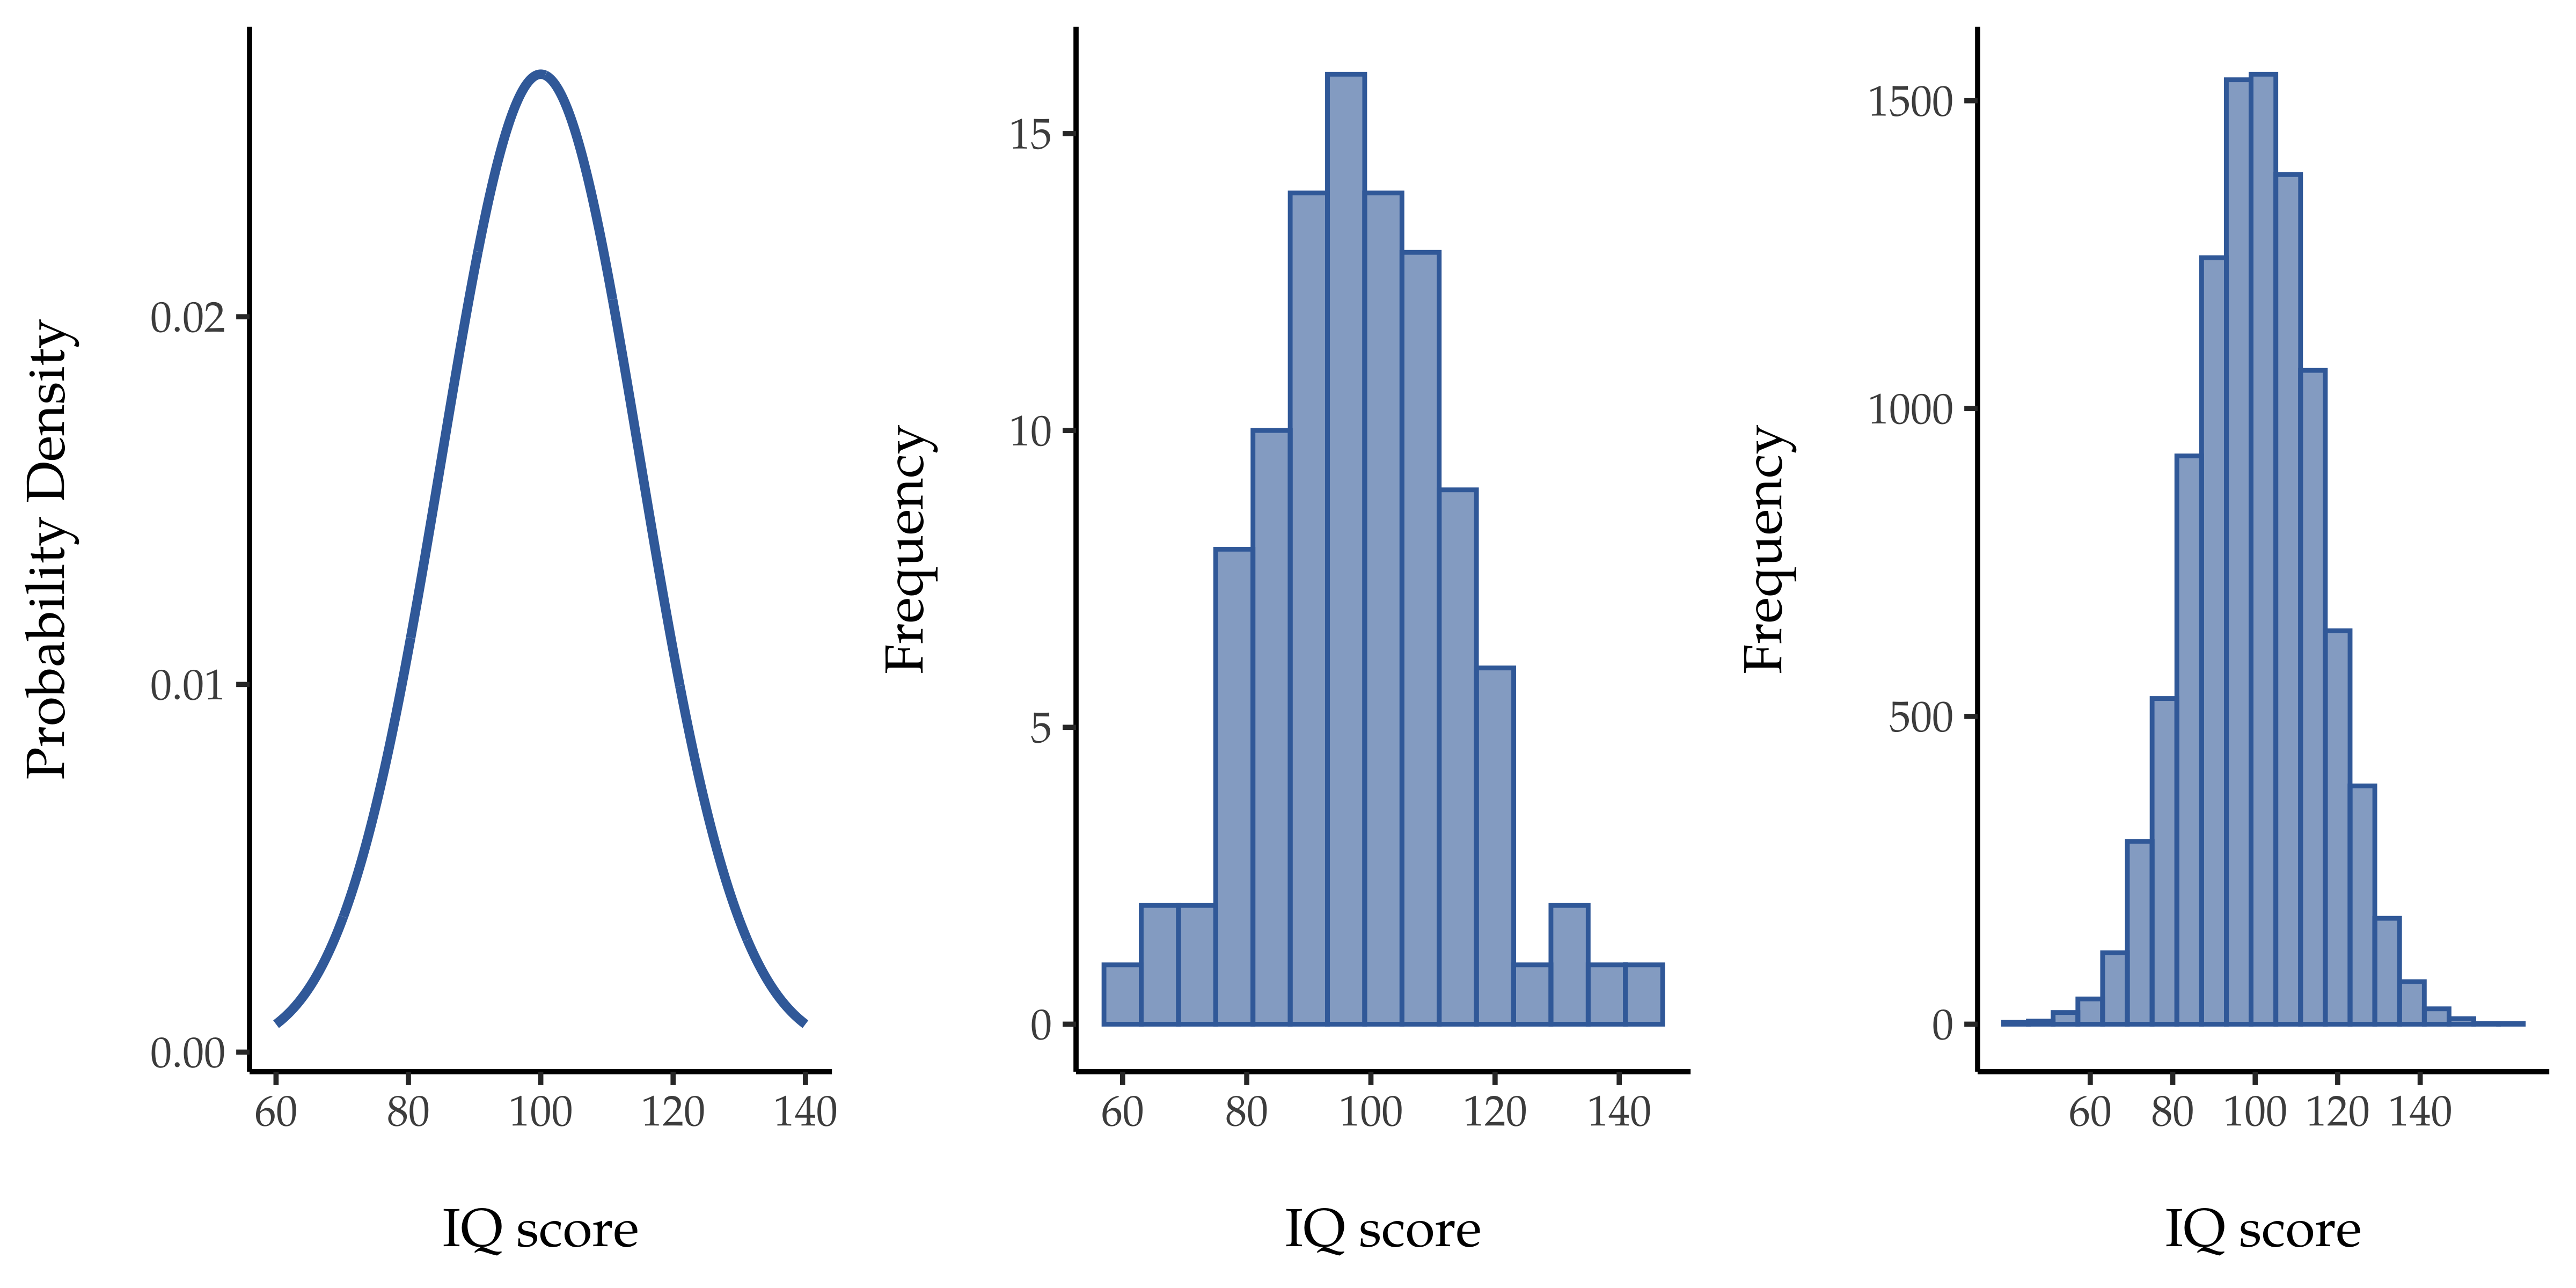
Fig. 72 The population distribution of IQ scores (left panel) and two samples drawn randomly from it: In the middle panel, we have a sample of 100 observations, and in the right panel, we have a sample of 10 000 observations.
Anta nå at jeg kjører et eksperiment. Jeg velger ut 100 tilfeldige personer og gjennomfører en IQ-test, slik at jeg får et enkelt tilfeldig utvalg fra populasjonen. Utvalget mitt vil bestå av en samling tall som dette:
106 101 98 80 74 … 107 72 100
Each of these IQ scores is sampled from a normal distribution with mean 100 and standard deviation 15. So if I plot a histogram of the sample I get something like the one shown in the middle panel of Fig. 72. As you can see, the histogram is roughly the right shape but it is a very crude approximation to the true population distribution shown in the left panel of Fig. 72. When I calculate the mean of my sample, I get a number that is fairly close to the population mean 100 but not identical. In this case, it turns out that the people in my sample have a mean IQ of 98.5, and the standard deviation of their IQ scores is 15.9. These sample statistics are properties of my data set, and although they are fairly similar to the true population values they are not the same. In general, sample statistics are the things you can calculate from your data set and the population parameters are the things you want to learn about. Later on in this chapter I will talk about how you can estimate population parameters using your sample statistics (Estimering av populasjonsparametere) and how to work out how confident you are in your estimates (Estimering av et konfidensintervall) but before we get to that there is a few more ideas in sampling theory that you need to know about.