Forfatter av avsnitt: Danielle J. Navarro and David R. Foxcroft
Kovariansanalyse (ANCOVA)
A variation in ANOVA is when you have an additional continuous variable
 that you think might be related to the dependent variable. This
additional variable can be added to the analysis as a covariate, in the aptly
named analysis of covariance (ANCOVA). In ANCOVA the values of the dependent
variable are “adjusted” for the influence of the covariate, and then the
“adjusted” score means are tested between groups
that you think might be related to the dependent variable. This
additional variable can be added to the analysis as a covariate, in the aptly
named analysis of covariance (ANCOVA). In ANCOVA the values of the dependent
variable are “adjusted” for the influence of the covariate, and then the
“adjusted” score means are tested between groups  in the usual way.
This technique can increase the precision of an experiment, and therefore
provide a more “powerful” test of the equality of group means in the dependent
variable. Although the covariate itself is typically not of any experimental
interest, adjusting for the covariate can reduce the error variance, and
thereby increase precision. This means that a failure to inappropriately reject
the null hypothesis (Type II error) becomes less likely.
in the usual way.
This technique can increase the precision of an experiment, and therefore
provide a more “powerful” test of the equality of group means in the dependent
variable. Although the covariate itself is typically not of any experimental
interest, adjusting for the covariate can reduce the error variance, and
thereby increase precision. This means that a failure to inappropriately reject
the null hypothesis (Type II error) becomes less likely.
Despite this advantage, ANCOVA runs the risk of undoing real differences
between groups , and this should be avoided. Look at
Fig. 176, for example, which shows a plot of Statistics anxiety
against age and shows two distinct groups – students who have either an Arts or
Science background. ANCOVA with age as a covariate might lead to the conclusion
that statistics anxiety does not differ in the two groups. Would this conclusion
be reasonable – probably not because the ages of the two groups do not overlap
and analysis of variance has essentially “extrapolated into a region with no
data” (Everitt, 1996).

Fig. 176 Plott av statistikk for angst mot alder for to forskjellige grupper
Det er klart at man må tenke nøye gjennom en kovariansanalyse med distinkte grupper. Dette gjelder både enveis- og faktorielle design, ettersom ANCOVA kan brukes med begge.
Kjører ANCOVA i jamovi
A health psychologist was interested in the effect of routine cycling and
stress on happiness levels, with age as a covariate. Open the ancova data set
in jamovi and then, to undertake an ANCOVA, select Analyses → ANOVA →
ANCOVA to open the ANCOVA analysis window (Fig. 177). Highlight
the dependent variable happiness and transfer it into the
Dependent Variable text box. Highlight the independent variables stress
and commute and transfer them into the Fixed Factors
text box. Highlight the covariate age and transfer it into the
Covariates text box. Then, click on Estimated Marginal Means to bring
up the plots and tables options.
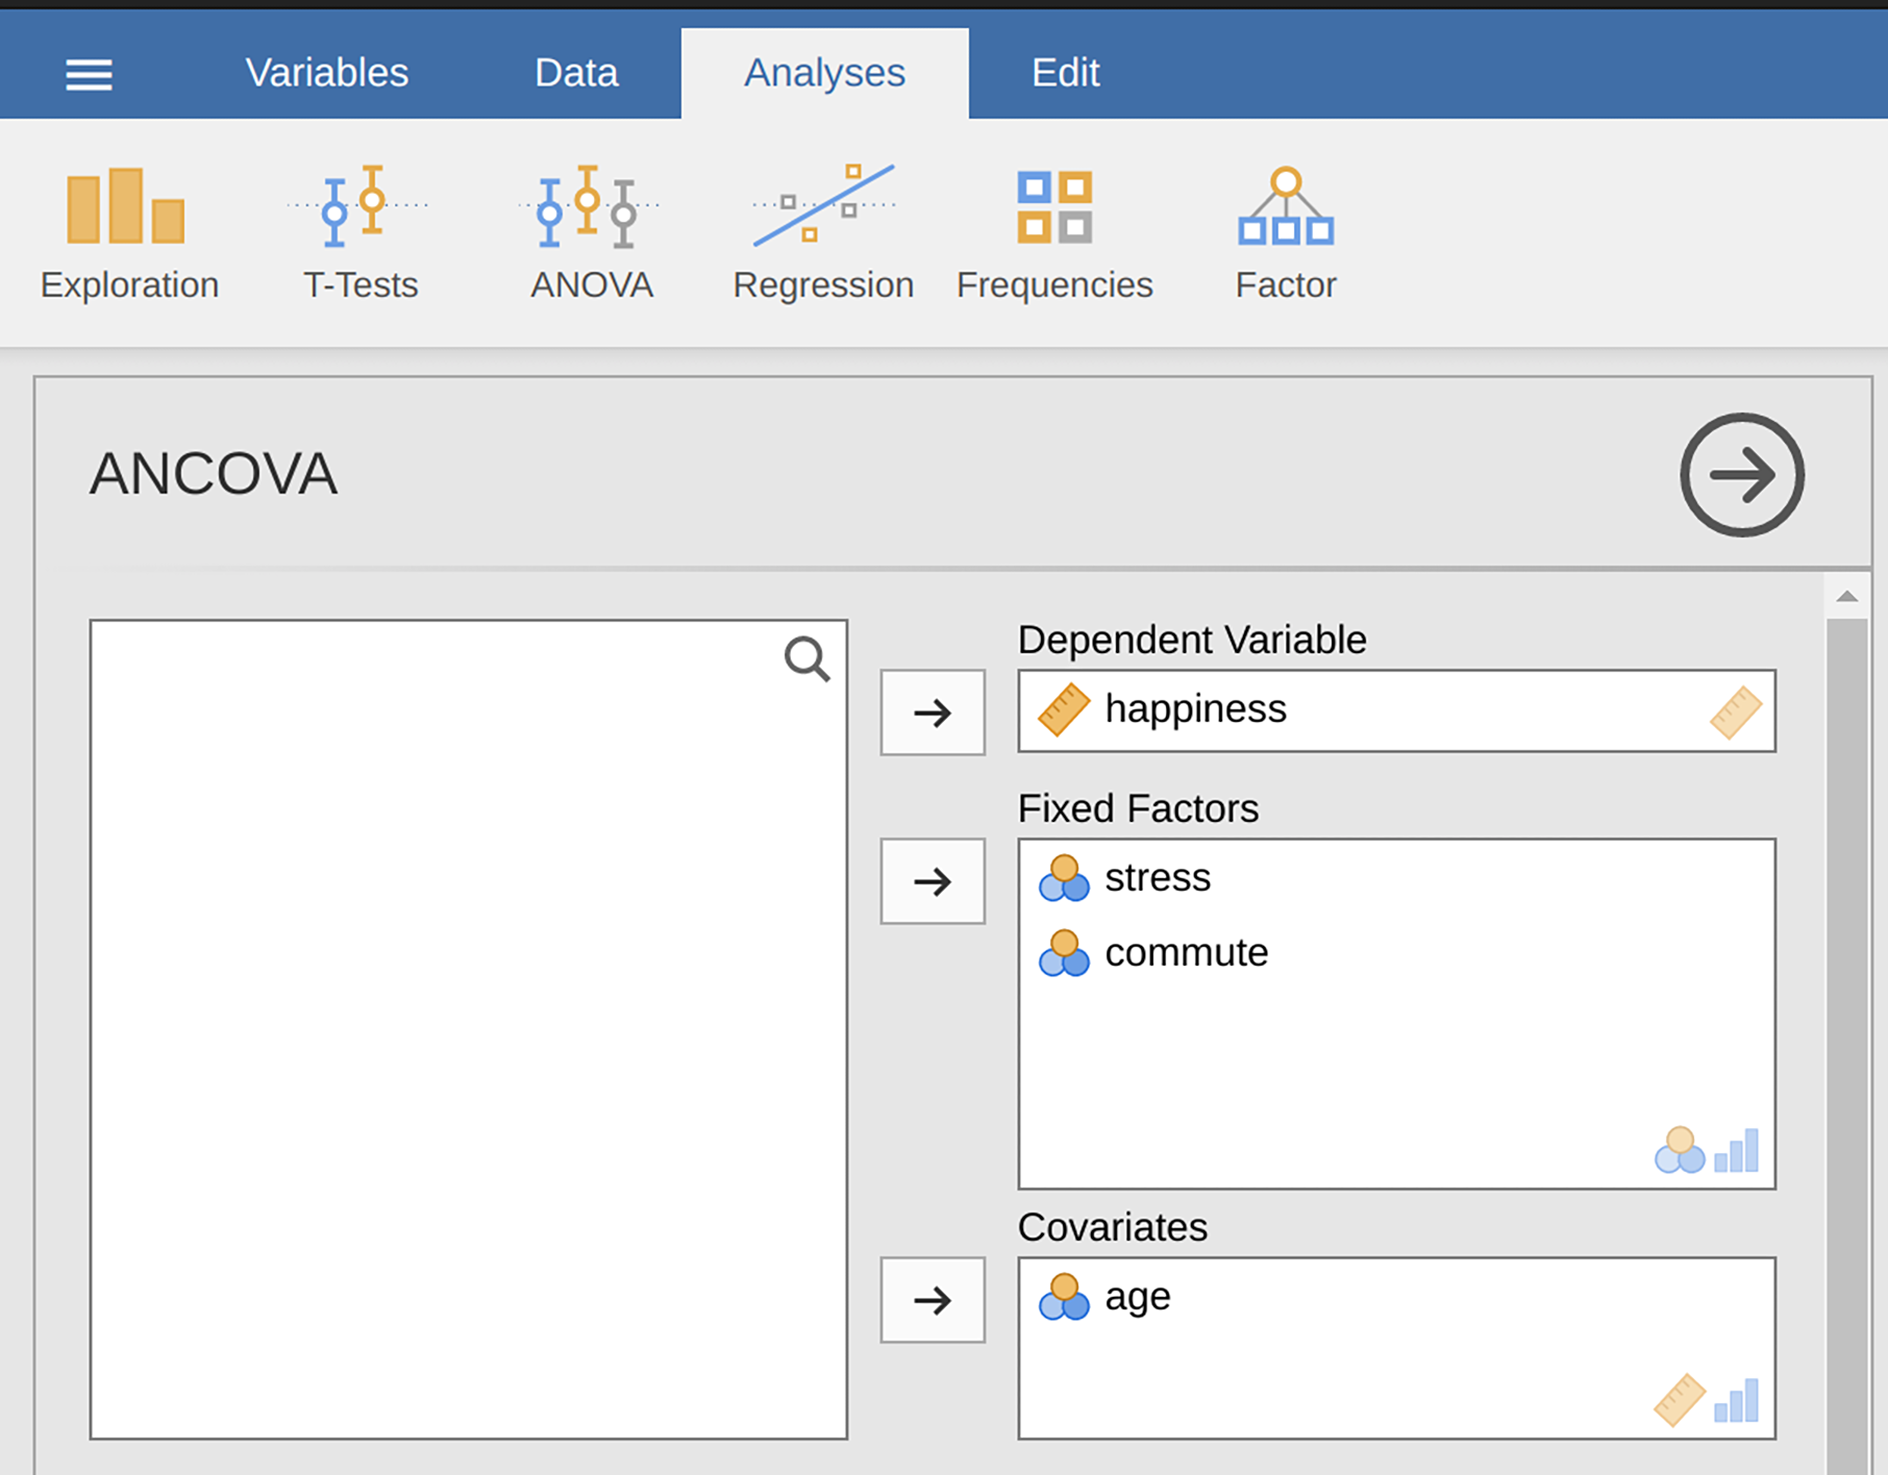
Fig. 177 Analysepanel for ANCOVA i jamovi som viser variabelboksene for å tilordne Dependent Variable, Fixed Factors og Covariates
An ANCOVA table showing Tests of Between-Subjects Effects is produced in the
jamovi results panel (Fig. 178). The F-value for the covariate
age is significant at p = 0.023, suggesting that age is an important
predictor of the dependent variable, happiness. When we look at the estimated
marginal mean scores (Fig. 179), adjustments have been made (compared
to an analysis without the covariate) because of the inclusion of the covariate
age in this ANCOVA. A plot (Fig. 180) is a good way of visualising
and interpreting the significant effects.
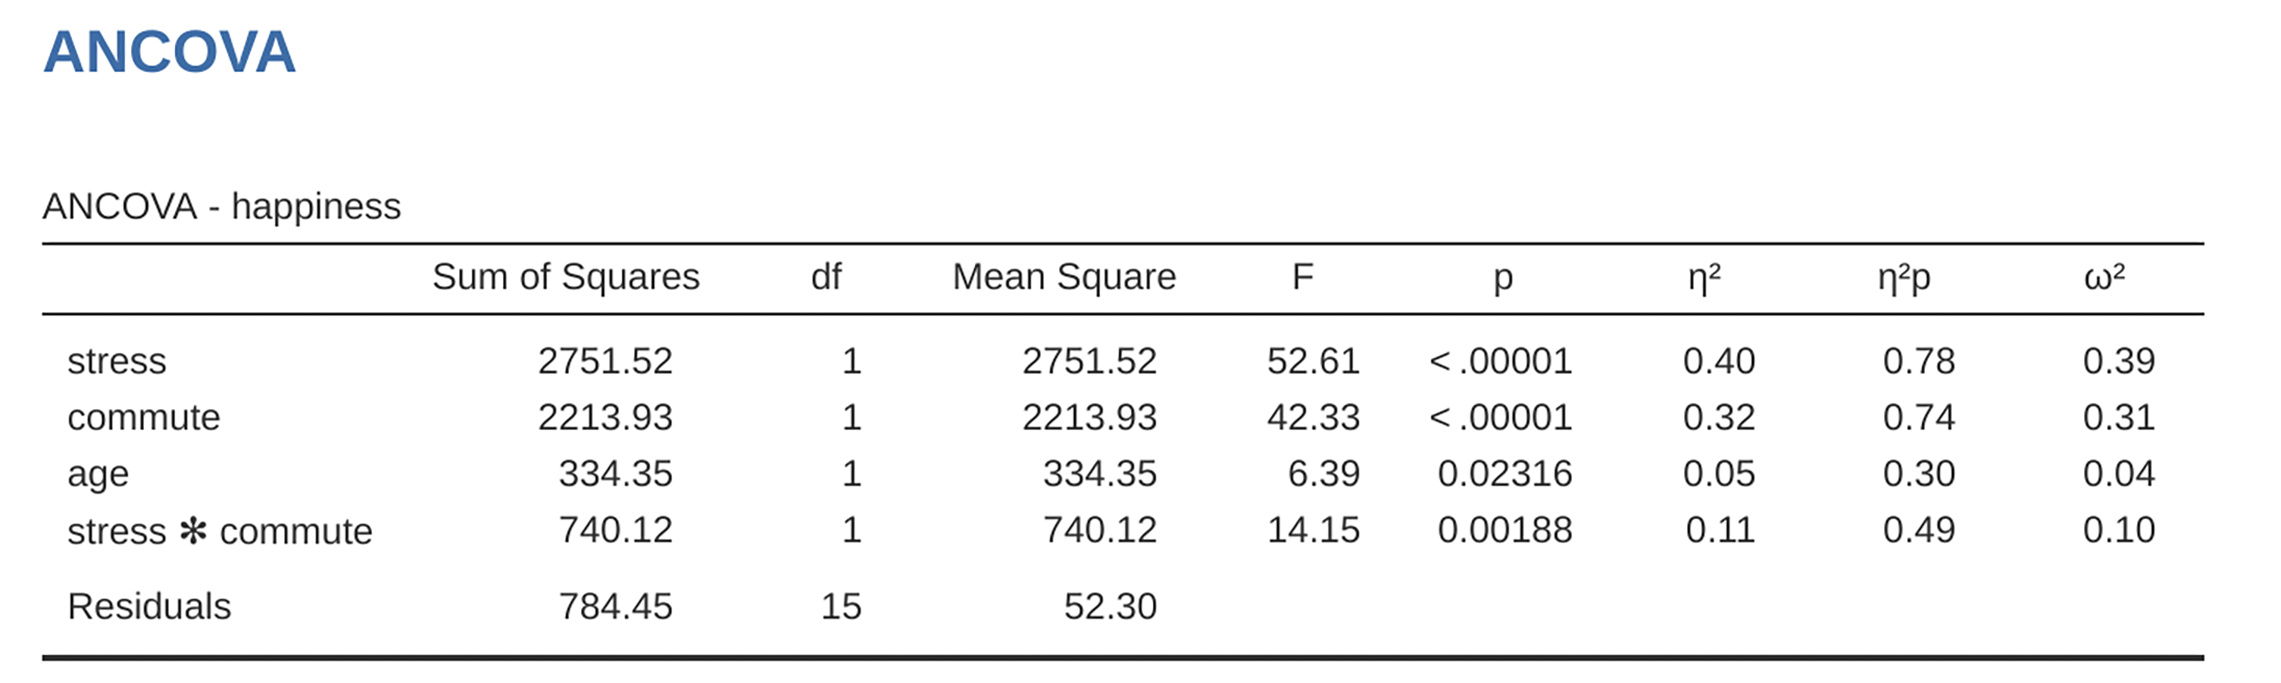
Fig. 178 Utgave fra ANCOVA for lykke som en funksjon av stress og pendlingsmetode, med alder som kovariat i jamovi
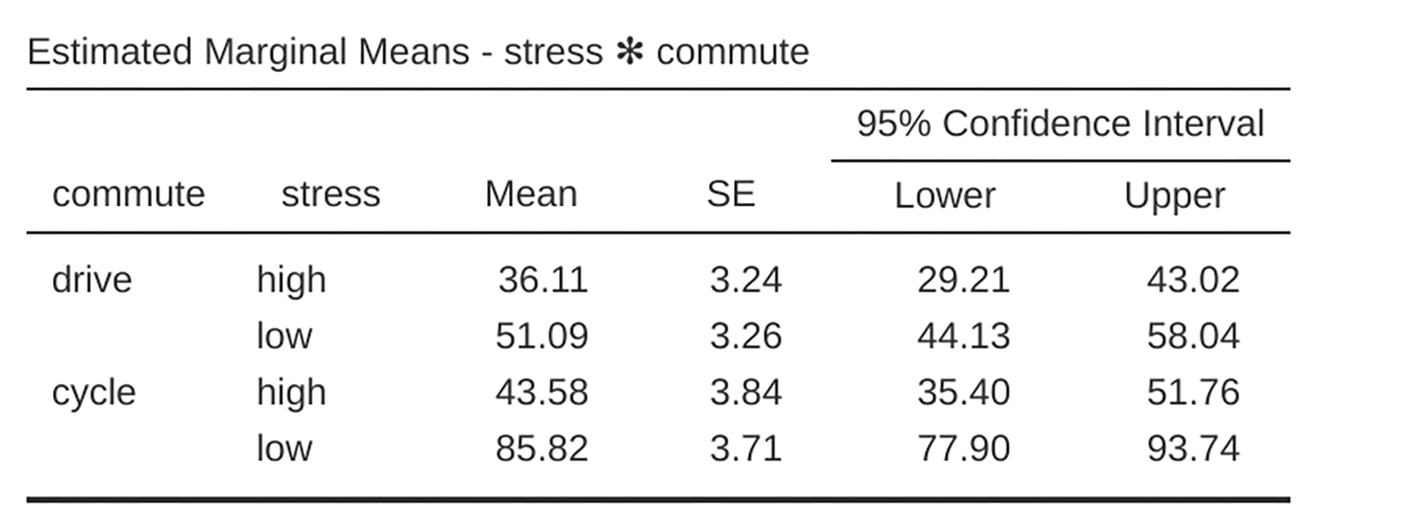
Fig. 179 Tabell med de estimerte randgjennomsnittene i ANCOVA: Her vises gjennomsnittlig lykkenivå som en funksjon av stress og pendlingsmetode (justert for kovariaten alder) med 95%-konfidensintervall
The F-value for the main effect stress (52.61) has an associated
probability of p < 0.001. The F-value for the main effect commute
(42.33) has an associated probability of p < 0.001. Since both of these are
less than the probability that is typically used to decide if a statistical
result is significant (p < 0.05) we can conclude that there was a significant
main effect of stress: F(1,15) = 52.61, p < 0.001, and a significant main
effect of commuting method: F(1,15) = 42.33, p < 0.001. A significant
interaction between stress and commuting method was also found: F(1,15) =
14.15, p = 0.002.
In Fig. 180 we can see the adjusted, marginal, mean happiness scores when age is a covariate in an ANCOVA. In this analysis there is a significant interaction effect, whereby people with low stress who cycle to work are happier than people with low stress who drive and people with high stress regardless of whether they cycle or drive to work. There is also a significant main effect of stress – people with low stress are happier than those with high stress. And there is also a significant main effect of commuting behaviour – people who cycle are happier, on average, than those who drive to work.

Fig. 180 Plott med de estimerte randgjennomsnittene i ANCOVA: Her vises gjennomsnittlig lykkenivå som en funksjon av stress og pendlingsmetode
En ting du må være oppmerksom på, er at hvis du vurderer å inkludere en kovariat i ANOVA-en din, er det en ekstra forutsetning: Forholdet mellom kovariaten og den avhengige variabelen skal være likt for alle nivåer av den uavhengige variabelen. Dette kan kontrolleres ved å legge til en interaksjonsterm mellom kovariaten og hver av de uavhengige variablene i jamovi Model → Model terms. Hvis interaksjonseffekten ikke er signifikant, kan den fjernes. Hvis den er signifikant, kan en annen og mer avansert statistisk teknikk være hensiktsmessig (noe som ligger utenfor denne bokens omfang, så det kan være lurt å rådføre seg med en vennligsinnet statistiker).