Forfatter av avsnitt: Danielle J. Navarro, and David R. Foxcroft, and Sebastian Jentschke
Trekker ut en delmengde av dataene
One very important kind of data handling is being able to extract a particular
subset of the data. For instance, you might be interested only in analysing the
data from one experimental condition, or you may want to look closely at the
data from people over 50 years in age. To achieve this, one could either use
a filter or create a new computed variable using
the FILTER() function. Regardless of the similar names, the two approaches
work slightly differently. Whereas filters apply to the whole data set (i.e.,
the same filter expression is applied to all analyses), the FILTER()
function permits you to generate a new variable that permits you to decide for
which analyses you would use that variable (e.g., to conduct only some analyses
separately for certain subgroups).
Using filters in jamovi
To get jamovi to filter the subset of the data corresponding to the
observations that you are interested in, we will use the nightgarden data
set. If you are reading the whole chapter in one sitting, then you should
already have this data set loaded into a jamovi window. Let us focus on the
two variables speaker and utterance (see Tabulering og krysstabulering av data
if you have forgotten what those variables look like). Suppose that what I
want to do is pull out only those utterances that were made by
makka-pakka. To that end, we need to specify a filter in jamovi. First
open up a filter window by clicking on Filters on the main jamovi Data
toolbar. Then, in the Filter 1 text box, next to the = sign, type the
following, including the single quote marks:
speaker == "makka-pakka"
When you have done this, you will see that a new column has been added to the
spreadsheet window (see Fig. 42), labelled Filter 1, with the
cases where speaker is not makka-pakka greyed-out (i.e., filtered out)
and, conversely, the cases where speaker is makka-pakka have a green
check mark indicating they are filtered in. You can test this by running
Exploration → Descriptives, assigning speaker to the Variables-
box and checking Frequency tables. Go on, try it!
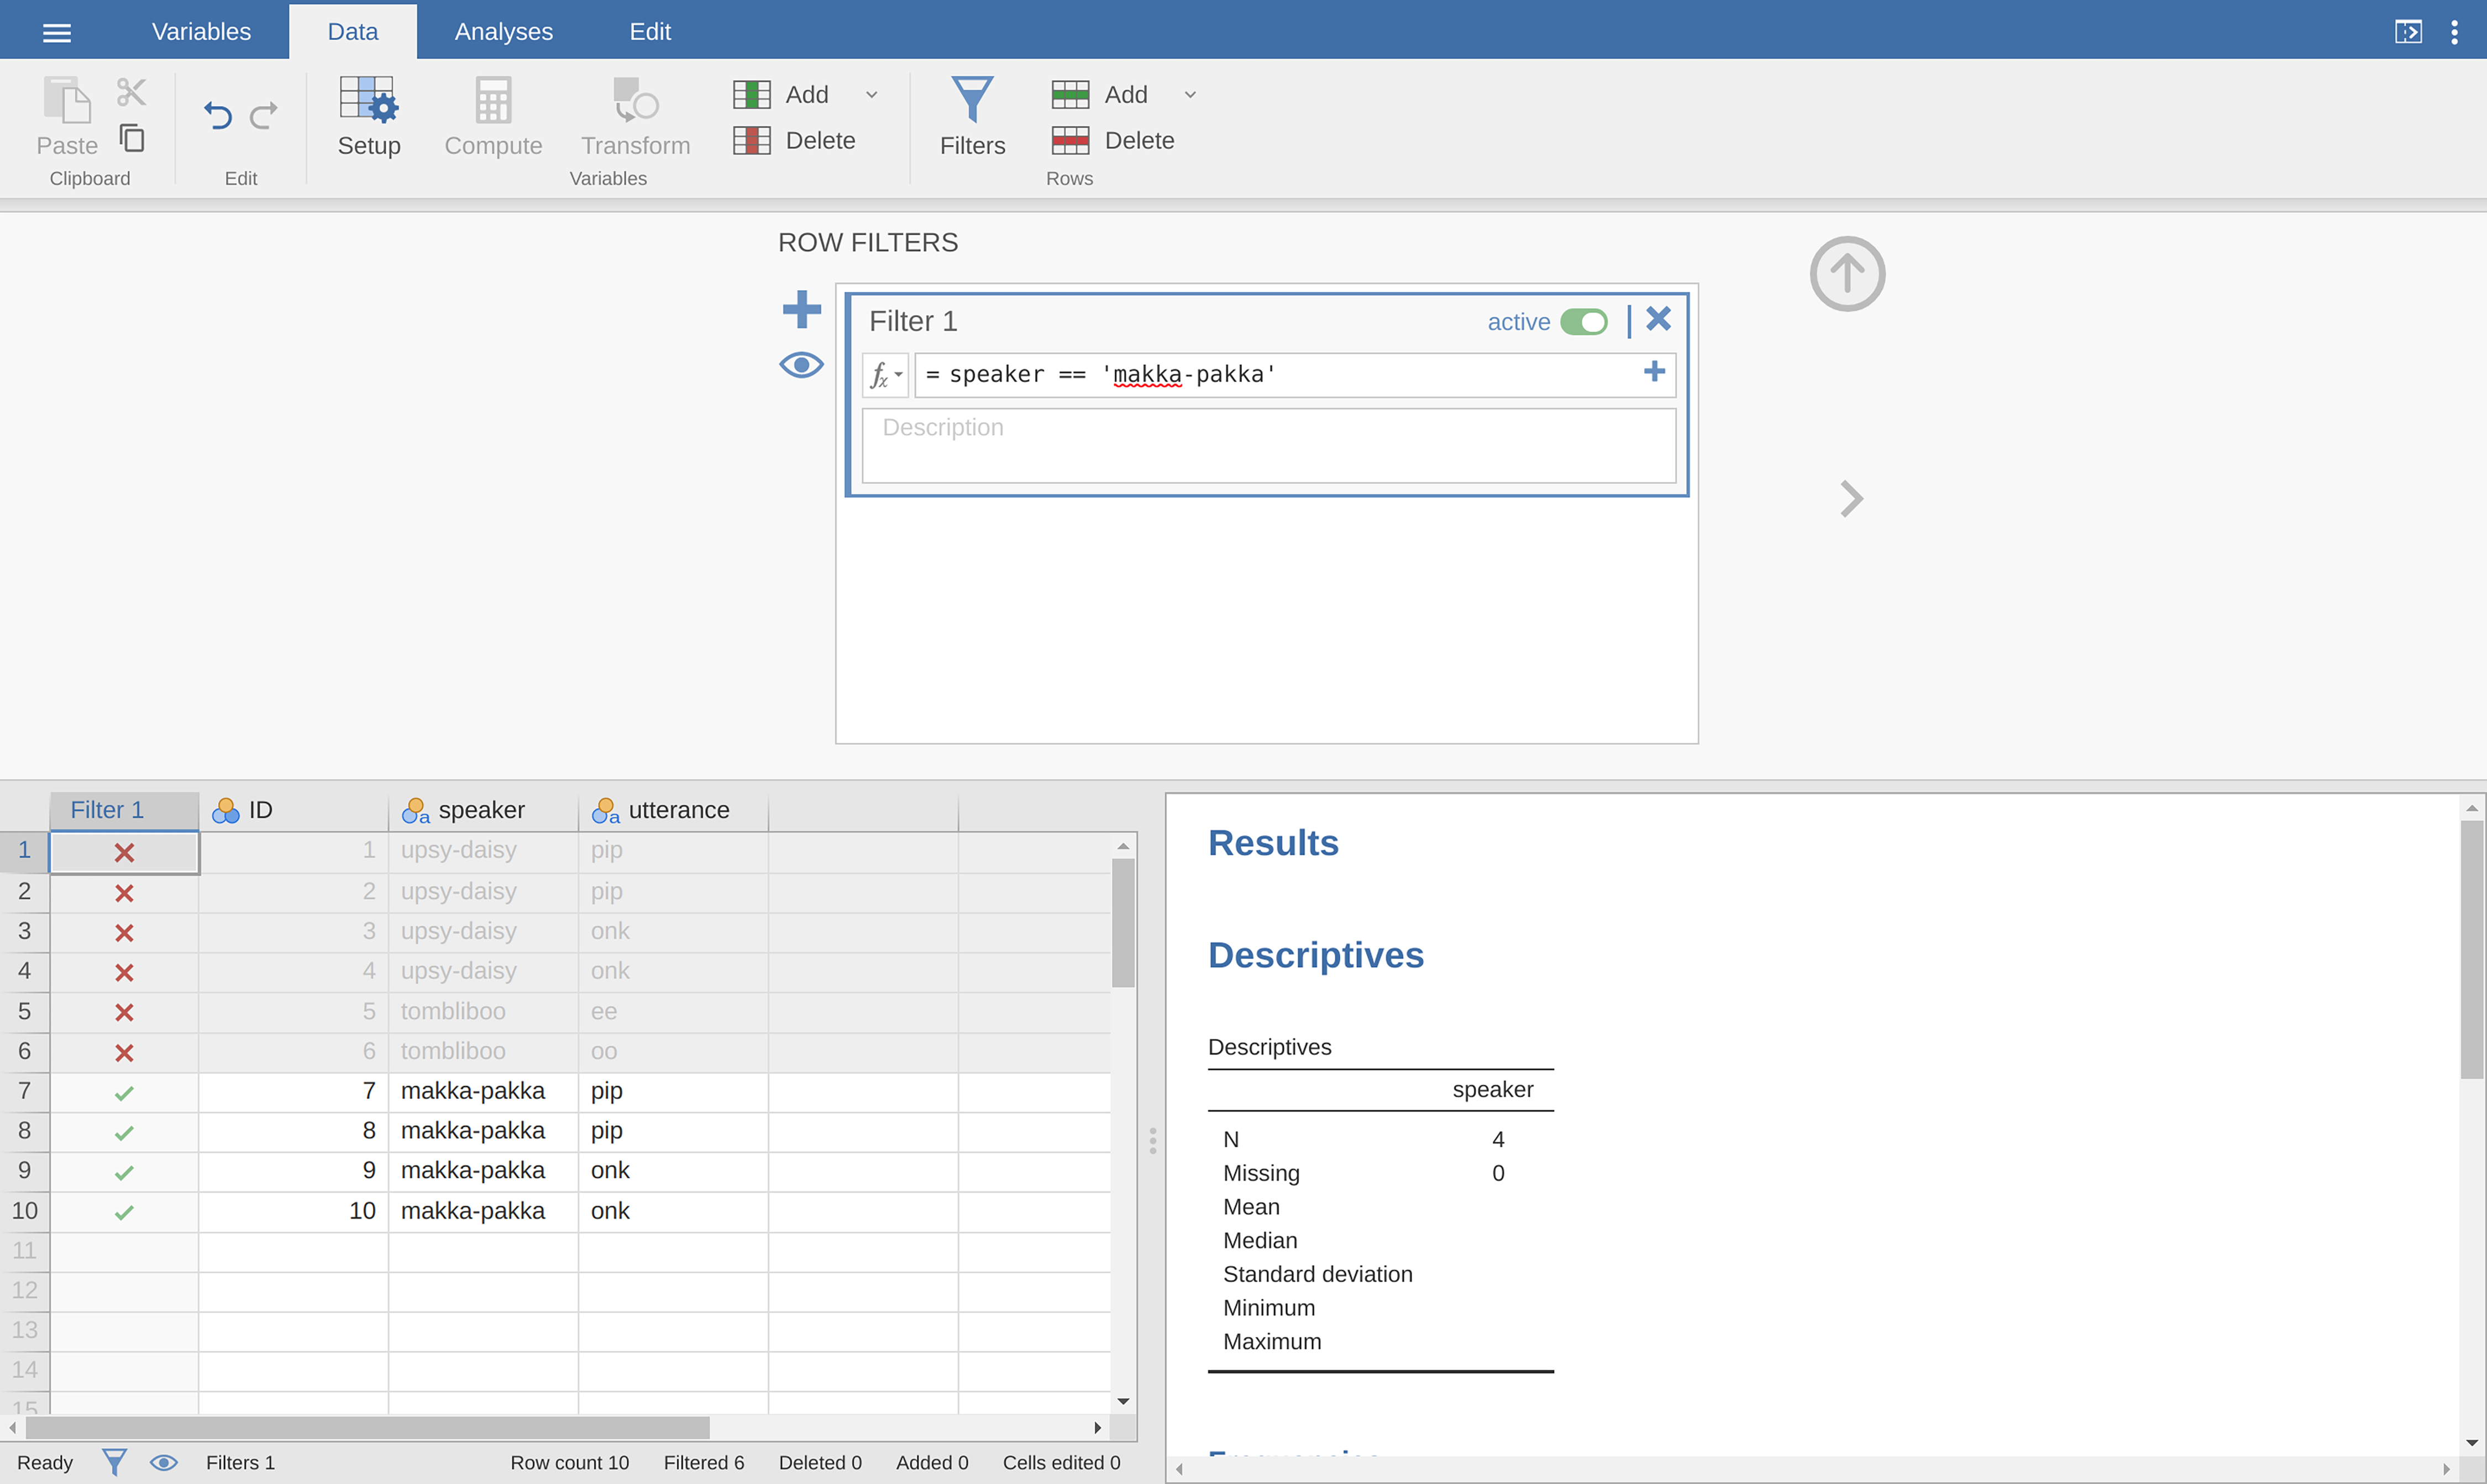
Fig. 42 Opprette en delmengde av datasettet nightgarden ved hjelp av jamovi Filters-funksjon
I forlengelsen av dette enkle eksempelet kan du også bygge opp mer komplekse filtre ved hjelp av logiske uttrykk i jamovi. Tenk deg for eksempel at jeg bare vil beholde de tilfellene der ytringen er enten pip eller oo. I så fall ville du i tekstboksen Filter 1, ved:
utterance == "pip" or utterance == "oo"
Creating filtered variables
Quite often one may want to run separate analyses for certain subgroups
without affecting all analyses contained in your jamovi data set. To achieve
that one needs to split a variable up into several different variables, each
corresponding to one subgroup. For instance, in our nightgarden data set,
I might want to create subsets of the utterance variable for every
character. One can achieve this by creating new computed variables that make use of the FILTER() function. The
function has two arguments: the variable that needs to be split into groups and
a filter expression (like the one that we used above) for selecting a specific
subgroup:
FILTER(utterance, speaker == "upsy-daisy")
FILTER(utterance, speaker == "tombliboo")
FILTER(utterance, speaker == "makka-pakka")
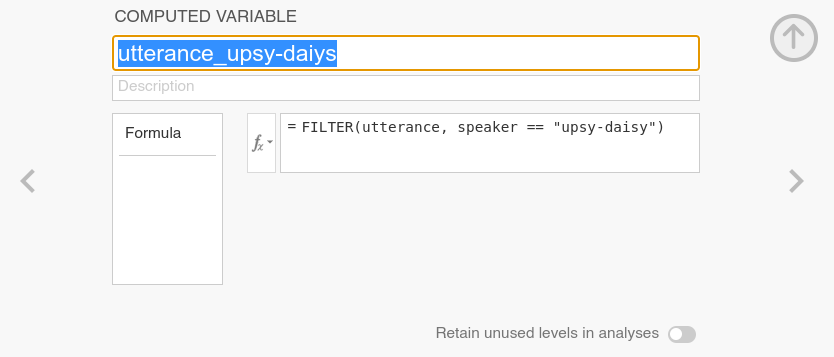
Fig. 43 Using a computed variable for creating a filtered variable
How a computed variable can be used to create a filtered variable is shown in
Fig. 43. Ideally, one would name those variables using a combination
of the variable that was split (utterance) with an indicator of which
subgroup was selected (e.g., utterance_upsy-daisy).
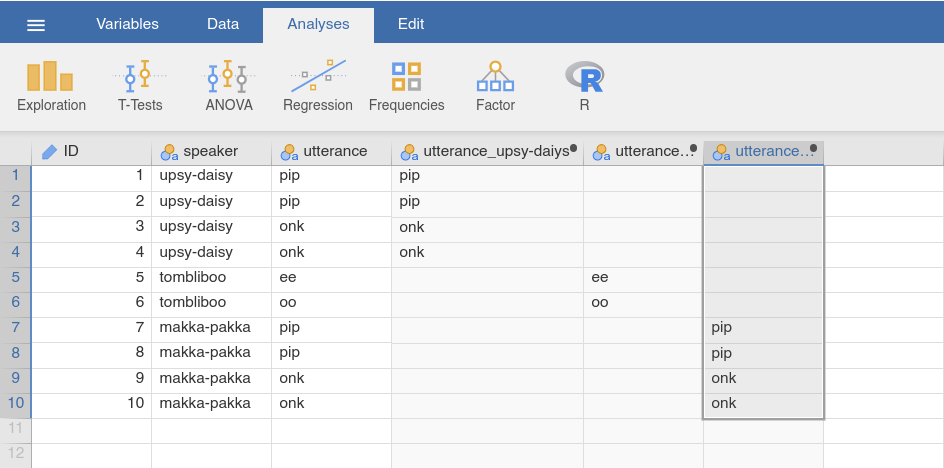
Fig. 44 Filtered variables in the spreadsheet created using the functions above
Once these variables have been created (see Fig. 44), one can use
them to run separate analyses for each of the subgroups. However, the
nightgarden dataset that we used here was merely a demonstration. It is
perhaps not the most useful data set for this purpose…