Автор раздела: Danielle J. Navarro and David R. Foxcroft
Post-hoc tests
Time to switch to a different topic. Rather than pre-planned comparisons that you have tested using contrasts, let us suppose you have done your ANOVA and it turns out that you obtained some significant effects. Because of the fact that the F-tests are “omnibus” tests that only really test the null hypothesis that there are no differences among groups, obtaining a significant effect does not tell you which groups are different to which other ones. We discussed this issue back in chapter Comparing several means (one-way ANOVA), and in that chapter our solution was to run t-tests for all possible pairs of groups, making corrections for multiple comparisons (e.g., Bonferroni, Holm) to control the Type I error rate across all comparisons. The methods that we used back there have the advantage of being relatively simple and being the kind of tools that you can use in a lot of different situations where you are testing multiple hypotheses, but they are not necessarily the best choices if you are interested in doing efficient post-hoc testing in an ANOVA context. There are actually quite a lot of different methods for performing multiple comparisons in the statistics literature (Hsu, 1996), and it would be beyond the scope of an introductory text like this one to discuss all of them in any detail.
That being said, there is one tool that I do want to draw your attention to,
namely Tukey’s “Honestly Significant Difference”, or Tukey’s HSD for short.
For once, I will spare you the formulas and just stick to the qualitative ideas.
The basic idea in Tukey’s HSD is to examine all relevant pairwise comparisons
between groups, and it is only really appropriate to use Tukey’s HSD if it is
pairwise differences that you are interested in.[1] For instance, earlier
we conducted a factorial ANOVA using the clinicaltrial data set, and where
we specified a main effect for drug and a main effect of therapy we
would be interested in the following four comparisons:
The difference in
mood.gainfor people givenanxifreeversus people given theplacebo.The difference in
mood.gainfor people givenjoyzepamversus people given theplacebo.The difference in
mood.gainfor people givenanxifreeversus people givenjoyzepam.The difference in
mood.gainfor people treated withCBTand people givenno.therapy.
For any one of these comparisons, we are interested in the true difference between (population) group means. Tukey’s HSD constructs simultaneous confidence intervals for all four of these comparisons. What we mean by 95% “simultaneous” confidence interval is that, if we were to repeat this study many times, then in 95% of the study results the confidence intervals would contain the relevant true value. Moreover, we can use these confidence intervals to calculate an adjusted p-value for any specific comparison.
The TukeyHSD function in jamovi is pretty easy to use. You simply specify
the ANOVA model term that you want to run the post-hoc tests for. For example,
if we were looking to run post-hoc tests for the main effects but not the
interaction, we would open up the drop-down menu Post Hoc Tests in the ANOVA
option panel, move the drug and therapy variables across to the box on
the right, and then select the Tukey checkbox in the list of possible
post-hoc corrections that could be applied. This, along with the corresponding
results table, is shown in Рис. 189.

Рис. 189 Options panel for setting up post-hoc test within jamovi’s factorial ANOVA
procedure (the current settings request a Tukey HSD statistic): Unsaturated
model with the factors drug and therapy but without an interaction
term (using the clinicaltrial data set)
The output shown in the Post Hoc Tests results table is (I hope) pretty
straightforward. The first comparison, for example, is the Anxifree versus
placebo difference, and the first part of the output indicates that the
observed difference in group means is 0.27. The next number is the standard
error for the difference. Then there is a column with the degrees of freedom,
a column with the t-value, and finally a column with the p-value. For the
first comparison the adjusted p-value is 0.21. In contrast, if you look at
the next line, we see that the observed difference between joyzepam and the
placebo is 1.03, and this result is significant (p < 0.001).
So far, so good. What about the situation where your model includes
interaction terms? For instance, the default option in jamovi is to
allow for the possibility that there is an interaction between drug and
therapy. If that is the case, the number of pairwise comparisons that we
need to consider starts to increase. As before, we need to consider the
three comparisons that are relevant to the main effect of drug and
the one comparison that is relevant to the main effect of therapy.
But, if we want to consider the possibility of a significant interaction
(and try to find the group differences that underpin that significant
interaction), we need to include comparisons such as the following:
The difference in
mood.gainfor people givenanxifreeand treated withCBT, versus people given theplaceboand treated withCBTThe difference in
mood.gainfor people givenanxifreeand givenno.therapy, versus people given theplaceboand givenno.therapy.etc.
There are quite a lot of these comparisons that you need to consider. So, when we run the Tukey post-hoc analysis for this ANOVA model, we see that it has made a lot of pairwise comparisons (19 in total), as shown in Рис. 190. You can see that it looks pretty similar to before, but with a lot more comparisons made.
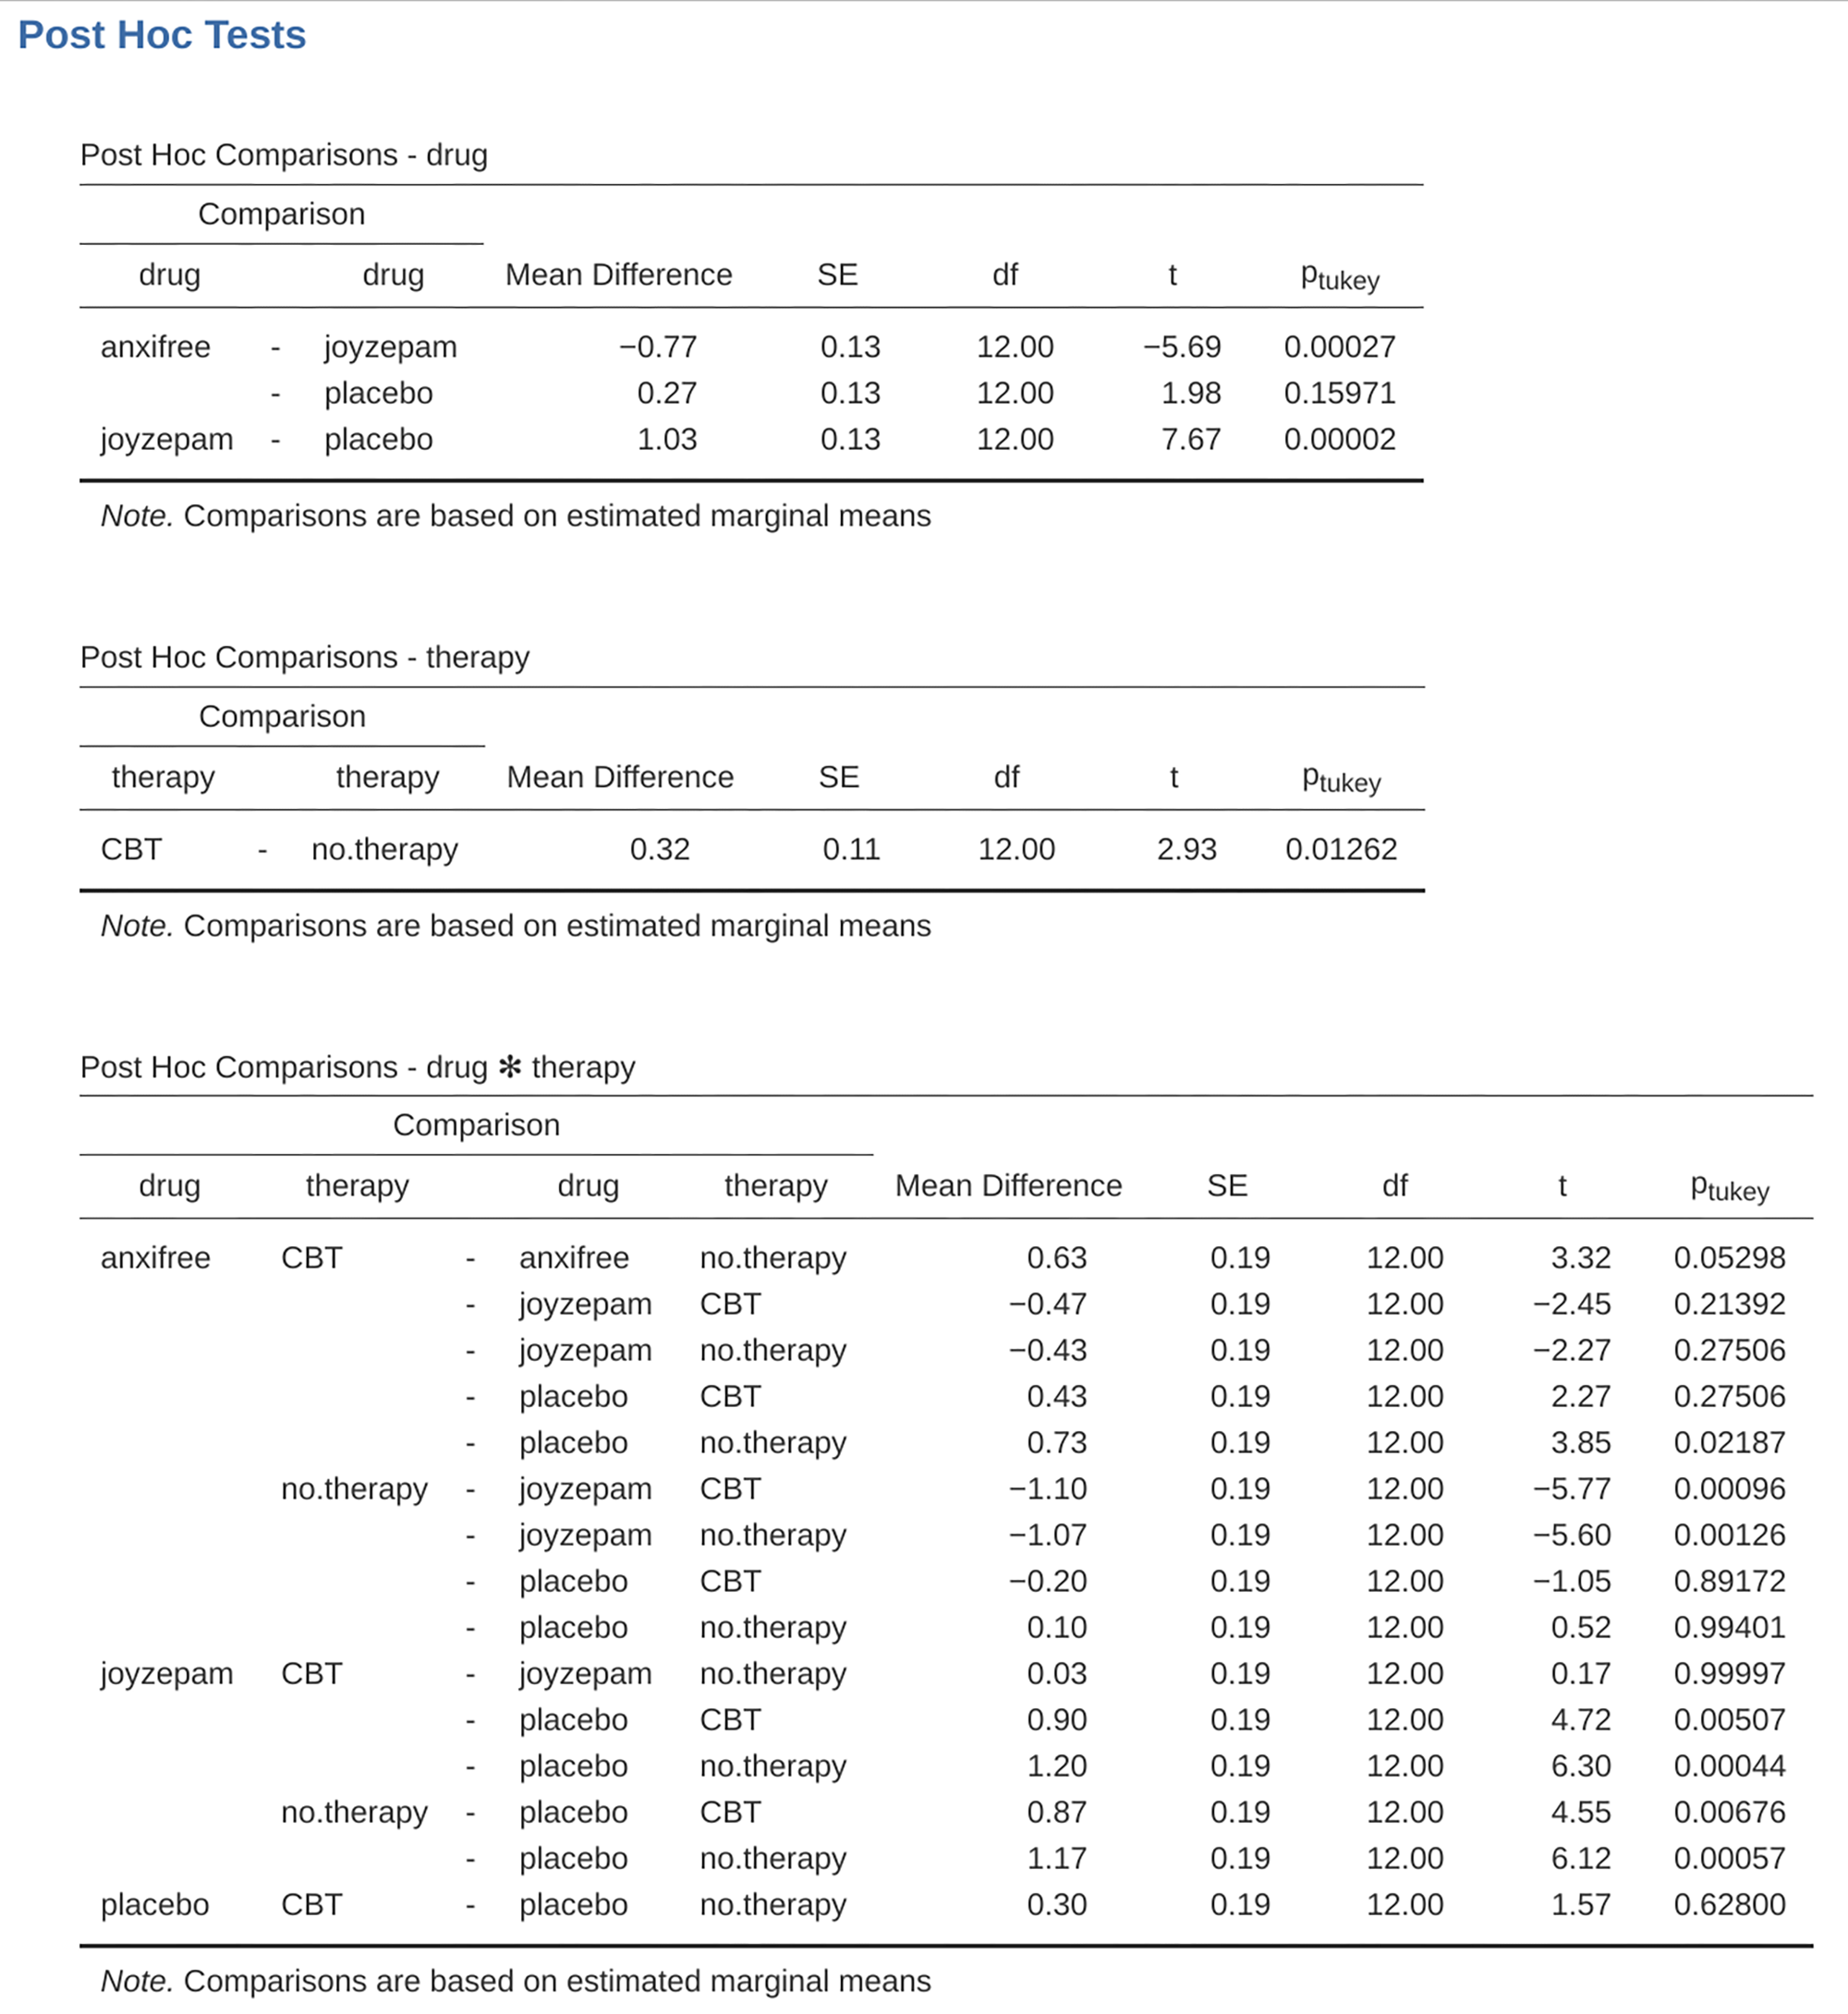
Рис. 190 Results table for a Tukey HSD post-hoc test within jamovi’s factorial ANOVA
procedure: Unsaturated model with the factors drug and therapy but
without an interaction term (using the clinicaltrial data set)