Section author: Danielle J. Navarro and David R. Foxcroft
Running the hypothesis test in practice
At this point some of you might be wondering if this is a “real”
hypothesis test, or just a toy example that I made up. It’s real. In the
previous discussion I built the test from first principles, thinking
that it was the simplest possible problem that you might ever encounter
in real life. However, this test already exists. It’s called the
binomial test, and it’s implemented by jamovi as one of the
statistical analyses available when you hit the Frequencies button.
To test the null hypothesis that the response probability is one-half
p = 0.5,[1] and using data in which x = 62 of n = 100
people made the correct response, available in the binomialtest data
set, we get the results shown in Fig. 70.
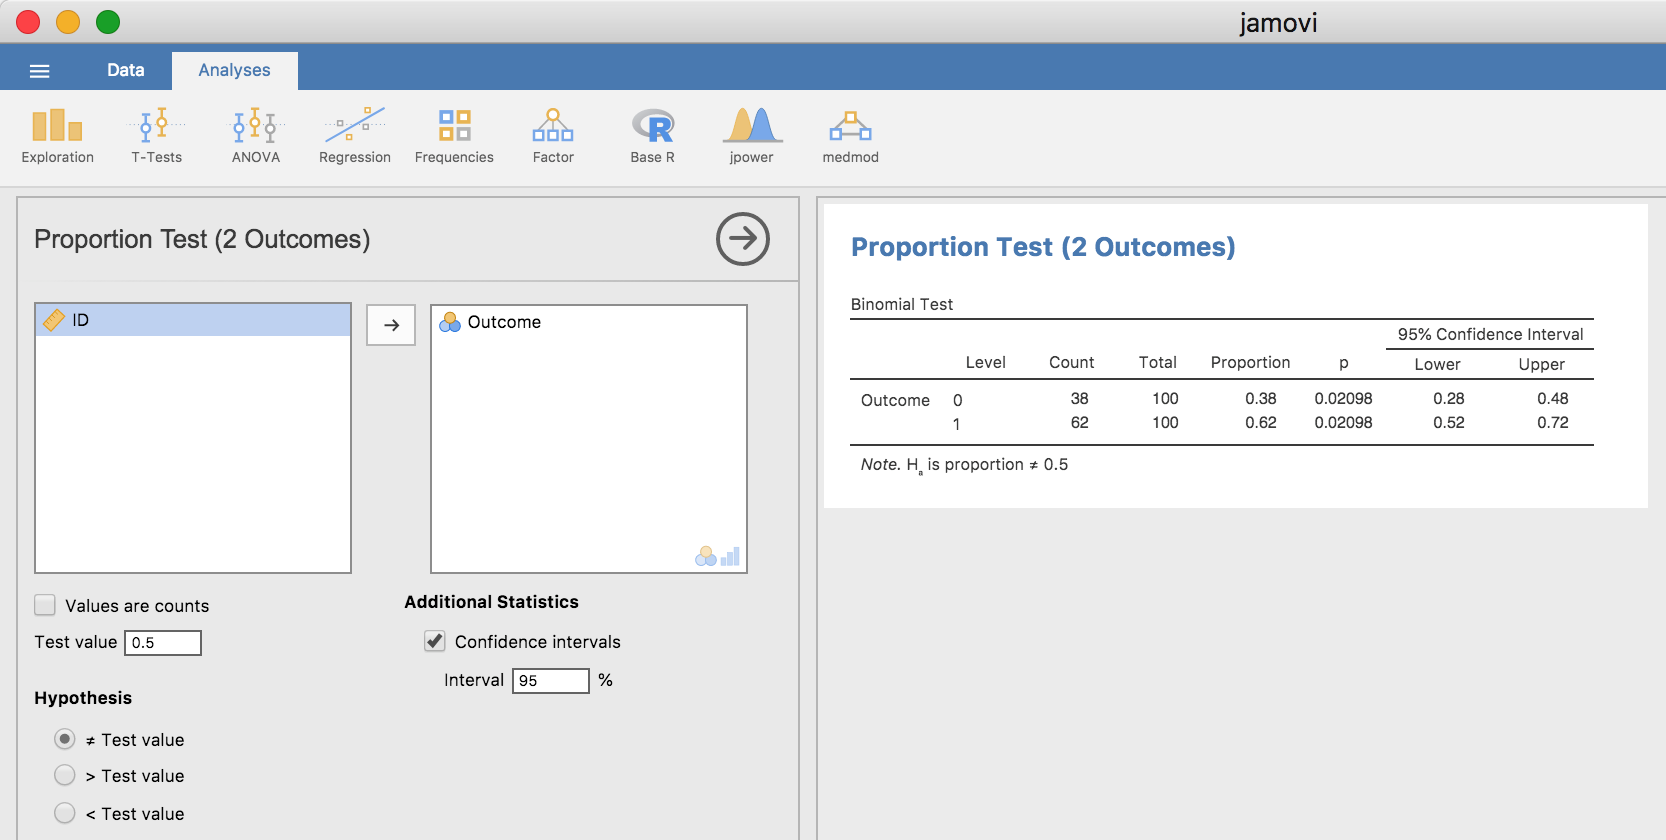
Fig. 70 Binomial test analysis and results in jamovi
Right now, this output looks pretty unfamiliar to you, but you can see that it’s telling you more or less the right things. Specifically, the p-value of 0.02 is less than the usual choice of α = 0.05, so you can reject the null. We’ll talk a lot more about how to read this sort of output as we go along, and after a while you’ll hopefully find it quite easy to read and understand.
| [1] | Note that the p here has nothing to do with a p-value.
The p argument in the jamovi binomial test corresponds to the
probability of making a correct response, according to the null
hypothesis. In other words, it’s the θ value. |