Section author: Danielle J. Navarro and David R. Foxcroft
Descriptive statistics separately for each group
It is very commonly the case that you find yourself needing to look at
descriptive statistics broken down by some grouping variable  . This is
pretty easy to do in jamovi. For instance, let’s say I want to look at the
descriptive statistics for some clinical trial data, broken down separately by
. This is
pretty easy to do in jamovi. For instance, let’s say I want to look at the
descriptive statistics for some clinical trial data, broken down separately by
therapy type. This is a new data set, one that you’ve never seen before.
The data is stored in the clinicaltrial data set and we’ll use it a lot in
chapter Comparing several means (one-way ANOVA) (you can find a complete description of the
data at the start of that chapter). Let’s load it and see what we’ve got:
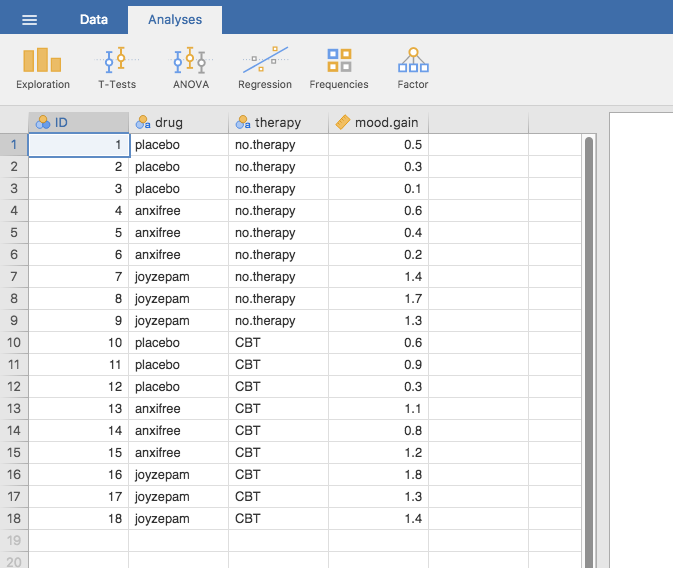
Fig. 17 Screenshot of jamovi showing the variables stored in the
clinicaltrial data set
Evidently there were three drugs: a placebo, something called “anxifree” and
something called “joyzepam”, and there were 6 people administered each drug.
There were 9 people treated using cognitive behavioural therapy (CBT) and 9
people who received no psychological treatment. And we can see from looking
at the Descriptives of the mood.gain variable that most people did show
a mood gain (mean = 0.88), though without knowing what the scale is here it’s
hard to say much more than that. Still, that’s not too bad. Overall I feel that
I learned something from that.
We can also go ahead and look at some other descriptive statistics, and this
time separately for each type of therapy. In jamovi, check Std. deviation,
Skewness and Kurtosis in the Statistics options. At the same
time, transfer the therapy variable into the Split by box, and you
should get something like Fig. 18.
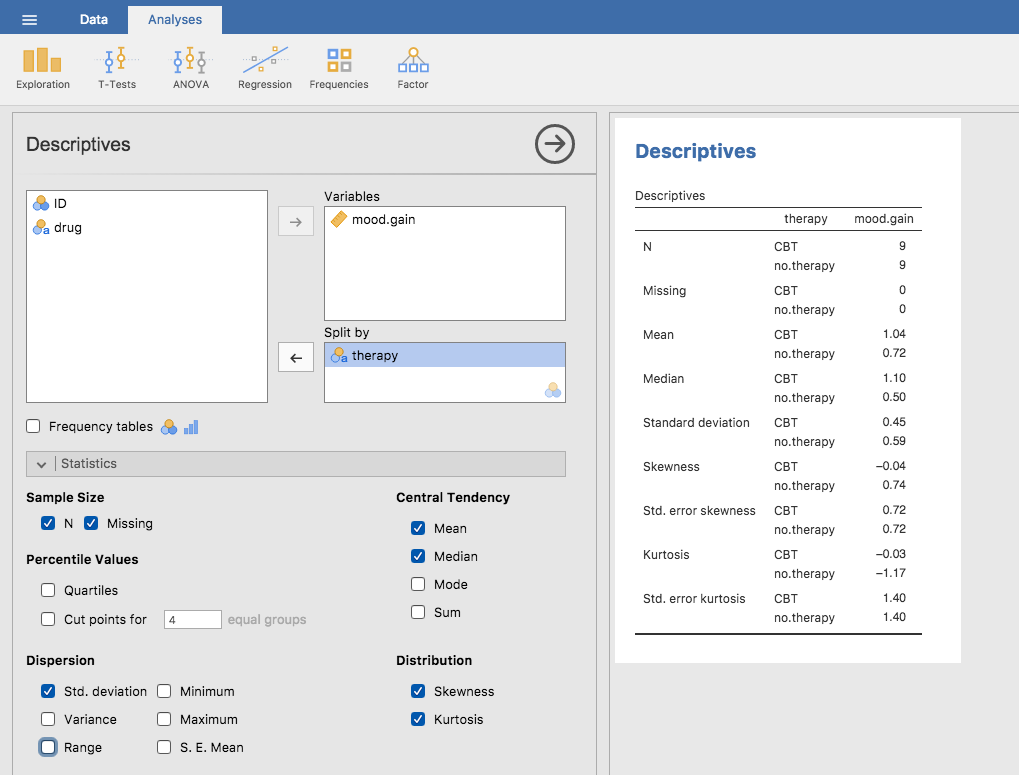
Fig. 18 Screenshot of jamovi showing Descriptives of the variables
in the clinicaltrial data set split by therapy type
What if you have multiple grouping variables ? Suppose you want to
look at the average mood gain separately for all possible combinations of
drug and therapy. It is possible to do this by adding another variable,
drug, into the Split by box. Easy peasy, though sometimes if you
split too much there isn’t enough data in each breakdown combination to
make meaningful calculations. In this case jamovi tells you this by
stating something like NaN or Inf.[1]
| [1] | Sometimes jamovi will also present numbers in an unusual way. If a number is very small, or very large, then jamovi switches to an exponential form for numbers. For example 6.51e-4 is the same as saying that the decimal point is moved 4 places to the left, so the actual number is 0.000651. If there is a plus sign (i.e. 6.51e+4 then the decimal point is moved to the right, i.e. 65,100.00. Usually only very small or very large numbers are expressed in this way, for example 6.51e-16, which would be quite unwieldy to write out in the normal way. |